A temperature or humidity number collected above a field can look precise while actually reflecting sun-heated hardware, rotor-stirred air or a sensor still catching up. Understanding what a civilian drone temperature and humidity sensor for microclimate mapping really samples helps Indian readers decide whether a colourful map is useful context—or a prompt for more careful measurement; this guide explains the measurement, the limits that matter most, and the role of current official checks before any civilian drone operation.
This article is part of the computer hardware technology guide library.
What a Drone Temperature and Humidity Sensor Measures
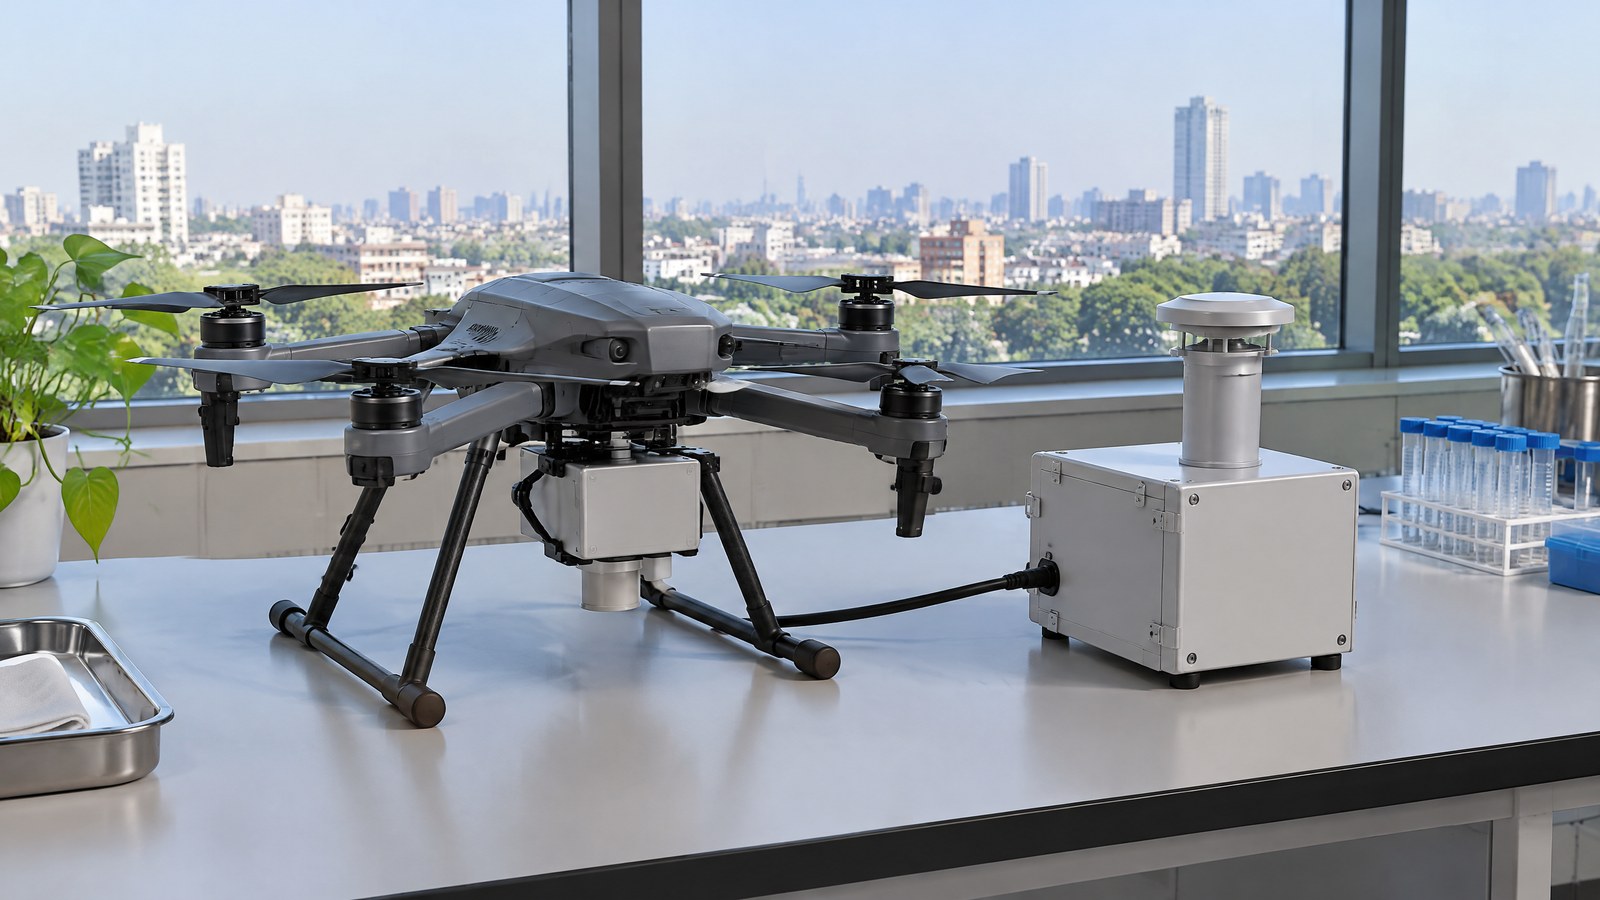
AI-generated editorial illustration of generic civilian drone hardware, not a photograph of a named product or an actual inspection.
A temperature and relative-humidity sensor is an environmental measurement payload, not a navigation or obstacle sensor. Its temperature element responds to the temperature of air reaching it. Its relative-humidity element estimates how close the air is to saturation with water vapour at that temperature. Taken together, the readings can describe conditions around the sensing element at a particular time and place; they do not directly measure crop health, soil moisture, material condition, rainfall, air quality or legal permission to fly.
For microclimate mapping, the useful question is usually comparative: do readings appear to differ between shaded and open areas, between canopy levels, or across a site during a defined observation period? A map is therefore more than a stream of sensor values. It joins observations to location and time, then presents a pattern whose credibility depends on the instrument, environmental exposure and reference evidence. The sensor can add an airborne viewpoint, but it does not turn a single pass into a complete description of a site’s climate.
Temperature, relative humidity and the local air sample
Relative humidity is not an independent “wetness” score. It changes with both water vapour and air temperature, because saturation depends on temperature. That is why a temperature shift, including one caused by sunlight or nearby electronics rather than ambient air, can alter the apparent RH pattern. The atmospheric measurement review by Jacob and colleagues describes an example in which a slower temperature response made relative humidity appear anomalously high across a rapid transition [1].
For a reader comparing points on a microclimate map, temperature and RH should remain paired. A cooler shaded point may have a different relative humidity from an exposed point even when the broader weather is similar. The meaningful claim is that the instrument observed different local samples under recorded conditions, not that it diagnosed the cause without other evidence.
Why the drone can influence the reading
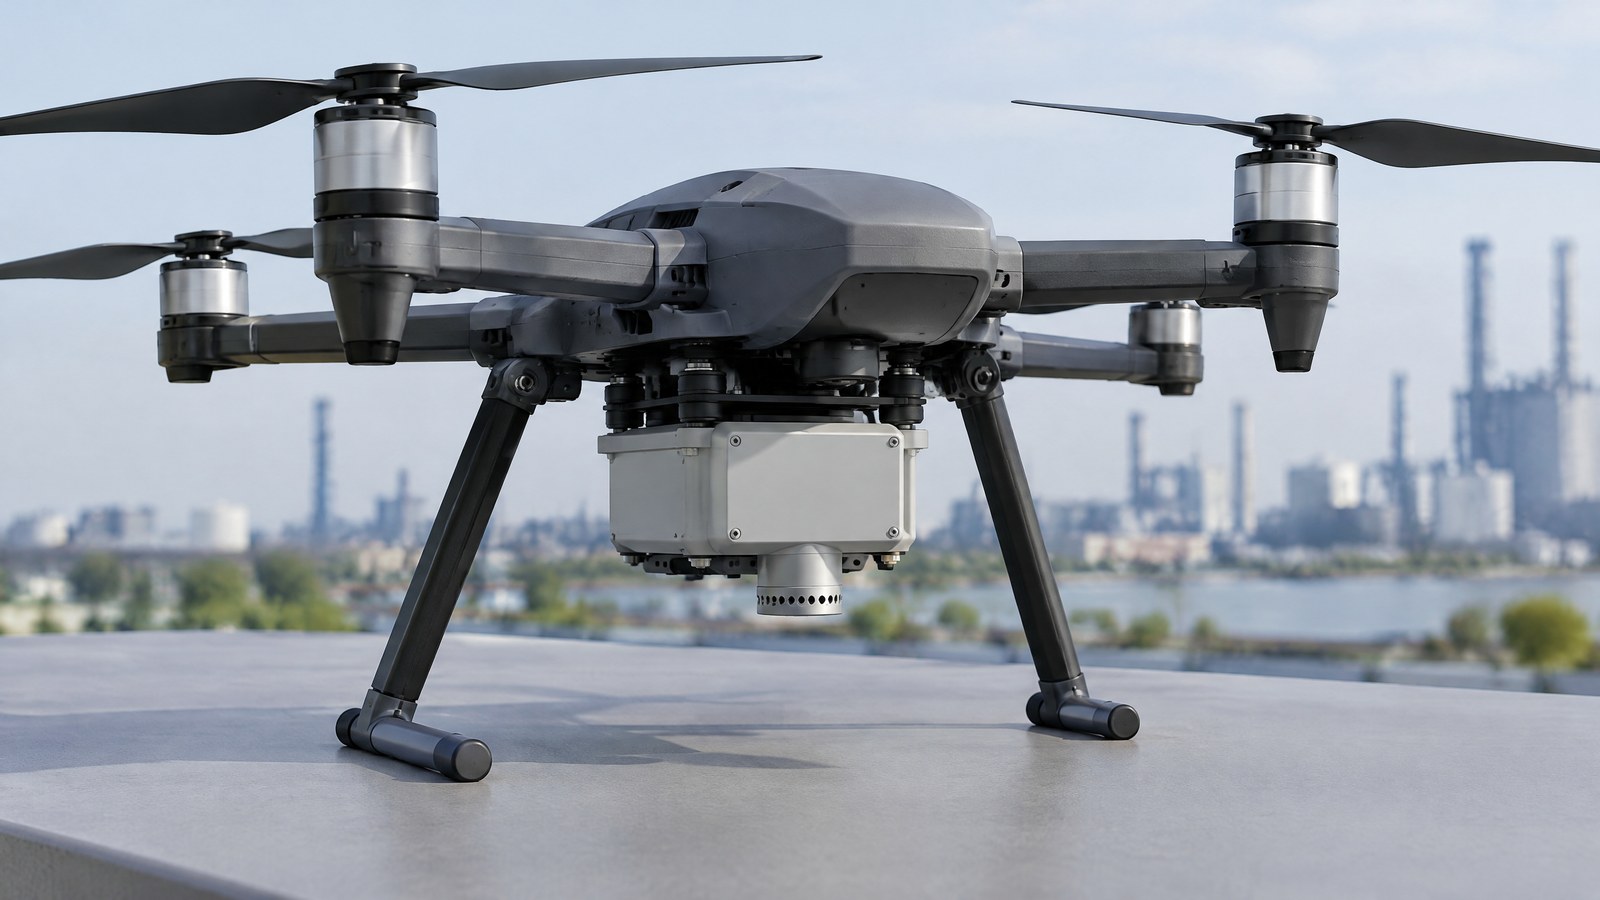
A multirotor needs to move air to stay aloft, so its own body, motors, electronics and propeller flow can affect the air near a sensor. Segales, Chilson and Salazar-Cerreño identify insufficient radiation shielding, turbulent propeller air and electronic self-heating as major sources of contamination for UAS temperature and humidity data [2]. These are measurement issues, not signs that every reading is unusable.
Greene and colleagues compared two sensor-integration approaches against tower-mounted reference instruments. Their results found both approaches could be valid, while the below-propeller arrangement was more susceptible to solar-radiation error and heat from the aircraft body [3]. The practical consumer lesson is modest: a value recorded on a drone is not automatically the same as undisturbed ambient air simply because the specification sheet shows fine resolution.
From readings to a cautious microclimate pattern
A microclimate pattern is more defensible when each observation can be interpreted with its conditions: the time of day, exposure to sun or shade, height relative to the ground or canopy, weather changes and the instrument’s documented behaviour. Consistent conditions make comparisons easier to explain, but they do not eliminate all uncertainty. Fast changes in temperature or moisture can outrun a sensor’s response, so apparent sharp boundaries may be softened, displaced or partly instrument-driven [1] [2].
Reference observations matter when conclusions have consequences. The 2018 review describes validation by comparison with known values, including instrumented towers, radiosondes and other validated UAS platforms [1]. For a civilian environmental project, that supports an evidence-first expectation: record how a claim was checked, and involve qualified domain professionals where the interpretation could affect agriculture, conservation, worker safety, building decisions or public communication.
Important Points / Key Information
The central distinction is simple: the sensor reports the air sample that reaches its sensing elements, while a microclimate map is an interpretation of many observations. Treat the reading as useful context, not a standalone verdict about a farm, forest, building or person. The following points help keep that distinction visible in civilian UAV sensor education.
Key Takeaways
Use these concise checks when reading a civilian drone temperature and relative-humidity result.
- A temperature and relative-humidity payload measures local air conditions at the sensing element; it does not directly measure soil moisture, crop stress, rainfall or a safety condition.
- Temperature and RH should be read together because relative humidity depends on temperature.
- Sun, propeller-driven mixing, aircraft heat and sensor response time can bias or delay a reading, so a map needs context and, when material, independent reference checks.
- A map can show a pattern worth investigating; it does not by itself identify the cause or replace a qualified assessment.
- Before a civilian flight in India, check the current official Digital Sky information, applicable rules, airspace status and any permissions for the specific operation.
How to judge a temperature and RH map
Start with the claim, not the colour scale. A responsible result says what was measured, when it was measured, what environment was being sampled and what limitations remain. It distinguishes a local observation from an inference such as “this area is water-stressed” or “this site is unsafe.” If a provider cannot explain these boundaries, a reader should not treat a visual overlay as a diagnosis.
It is also sensible to ask whether the work separates air temperature from surface temperature. A thermal-infrared camera estimates emitted radiation from surfaces and needs its own interpretation; an air-temperature/RH payload is trying to characterize air. They can be complementary in a legitimate civilian study, but one is not a substitute for the other. This article is intentionally about airborne air measurements rather than thermal inspection or LiDAR mapping.
India context: current checks are part of responsible use
An environmental payload does not create a separate exemption from civilian aviation requirements. On 19 October 2026, the Ministry of Civil Aviation’s official rules listing included the Drone (Amendment) Rules, 2022 [5]. A Government of India backgrounder on the Drone Rules, 2021 says the airspace map may be modified by authorised entities and that anyone planning to operate a drone should check the latest map for zone-boundary changes [6].
That is a reason to make a current official Digital Sky and rule check part of the project decision, rather than relying on an old blog post, a screenshot or another operator’s experience. The applicable category, registration, pilot, airspace, local land-access, privacy and other requirements depend on the actual operation and may change. This educational article cannot determine whether a particular flight is permitted.
Examples / Supporting Information
The most useful supporting example is not a promise of instant field insight but a research workflow that combines different evidence types. Marsh and colleagues studied microclimatic air temperature in a tropical rainforest using UAV canopy surveys and in-situ microclimate data loggers. They concluded that UAV survey data together with in-situ measurements could predict microclimatic air temperature at a given height and time of day within the study forest [4]. The study also notes limits in what UAV-derived structure could reveal beneath a multi-layer canopy. Its lesson is that airborne coverage and ground or canopy reference observations can complement each other.
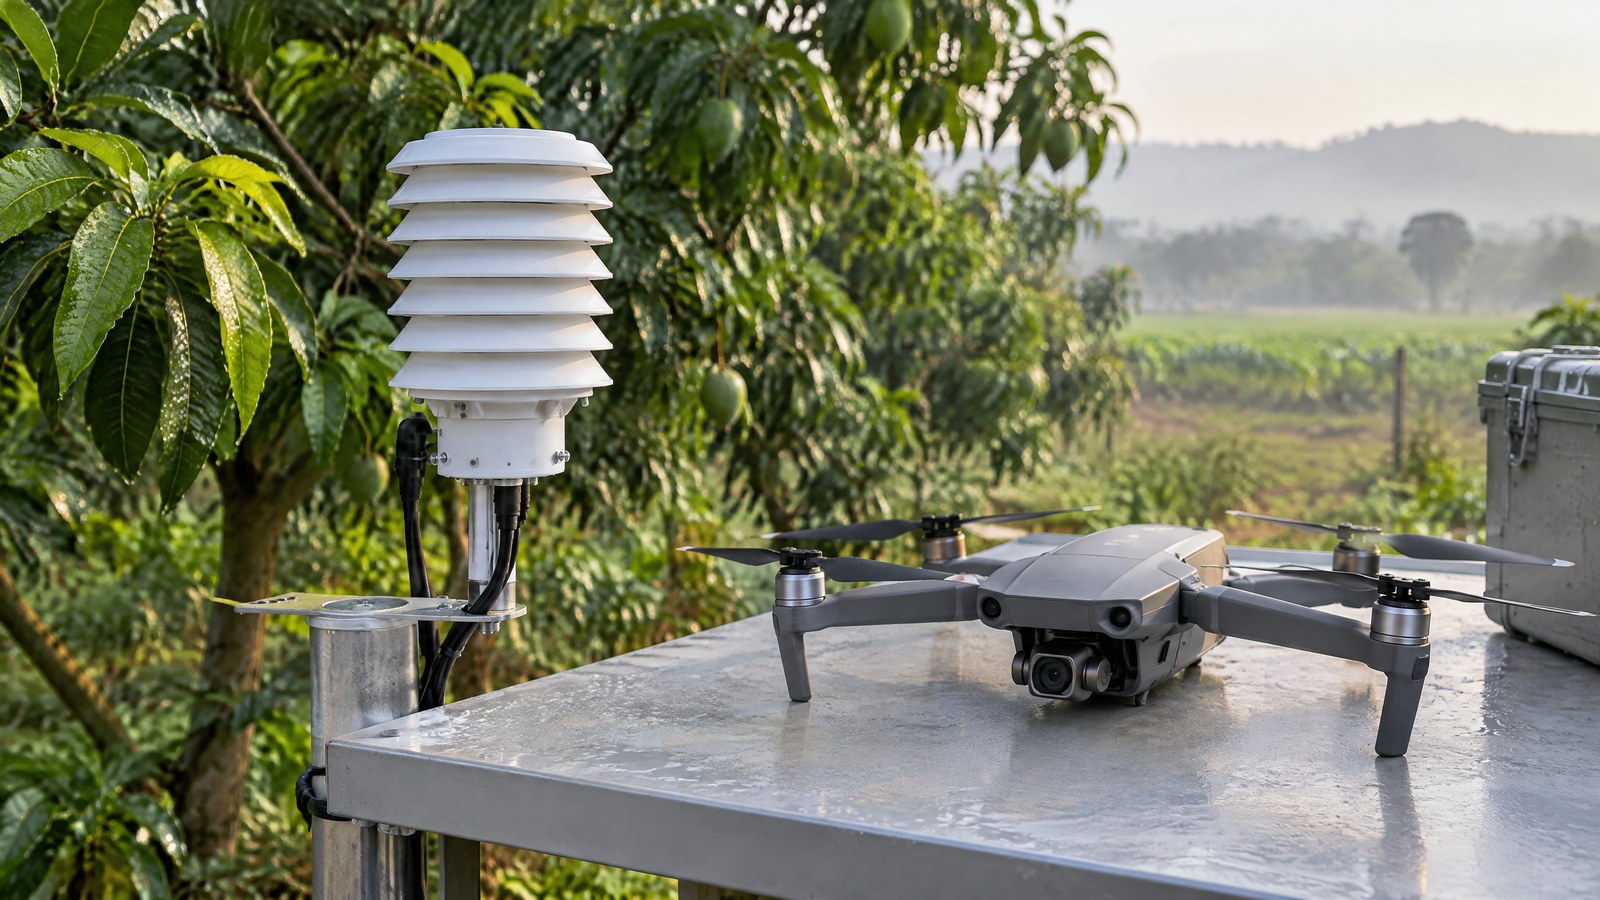
Illustrative India scenario: a horticultural research group wants to understand whether an orchard’s shaded and open zones show different near-canopy conditions during one documented observation window. An airborne temperature/RH dataset might help the group identify spatial differences worth comparing against fixed local measurements and field observations. It would not, on its own, establish irrigation need, plant disease, yield, tenancy rights or a recommended treatment.
Illustrative environmental scenario: a university field class compares readings near a tree line with readings over nearby open ground as part of a civilian monitoring exercise. The honest output would identify the date and conditions, say that it is a limited observation, retain its source record and avoid presenting a single survey as a seasonal climate conclusion. This is different from a surveillance task: the purpose is environmental interpretation, and the article does not provide instructions for observing people or evading oversight.
What research evidence supports—and does not support
The strongest evidence here supports caution about data quality. The reviewed UAS studies show why solar exposure, airflow, aircraft heat and response time deserve attention [1] [2] [3]. They do not establish a universal error number for all consumer accessories, an accuracy guarantee for a particular drone, or a claim that every site can be microclimate-mapped from a short airborne survey.
Likewise, the forest research shows a productive combination of UAV-derived structural information and in-situ loggers in one specific study [4]. It does not prove that the same approach will work unchanged in Indian orchards, cities, wetlands or industrial sites. Treat any proposed application as a hypothesis to be assessed with appropriate scientific, agricultural, environmental or engineering expertise.
Conclusion
A drone temperature and humidity sensor for microclimate mapping can contribute a local, time-stamped view of air conditions, especially when readers want to compare environments rather than chase a single “perfect” number. Its value comes from disciplined interpretation: keep temperature and RH together, account for sunlight, airflow and response limits, use reference evidence when stakes are high, and state what a map cannot prove.
For Indian civilian use, the same restraint applies to compliance. Check the live official Digital Sky information and applicable requirements for the real operation, rather than assuming that an environmental purpose or a sensor payload makes a flight permissible. A trustworthy result is a transparent observation with limits, not an automated decision or guarantee.
Source notes
Reporting record
techduopulse stores source destinations privately. Public notes remain non-clickable so every visitor journey stays on this website.
[1] Sensor integration, calibration and validation matter; response time, airflow, shielding and nearby heat can affect UAS thermodynamic measurements.
Primary source · Measurement limits[2] The research identifies radiation, propeller-induced turbulence and electronic self-heating as possible contamination sources for UAS temperature and humidity data.
Primary source · Measurement limits[3] A rotary-wing UAS study found sensor integration could be affected by solar radiation and heat from the aircraft body.
Primary source · Measurement limits[4] A tropical-forest study combined UAV canopy surveys with in-situ microclimate data loggers to model air temperature at a stated height and time of day.
Primary source · Supporting information[5] The official Ministry rules listing included Drone (Amendment) Rules, 2022 at the time of access.
Primary source · India context[6] The Government backgrounder says authorised entities may modify the airspace map and calls for checking the latest map before a planned operation.
Primary source · India contextInitial civilian drone-sensor explainer; sources and AI-generated illustrative imagery reviewed before publication.