Street-level monitors can miss how particle levels change above a road, an industrial boundary or an open area. A civilian drone particulate-matter sensor can add a height-specific sample to an air-quality mapping exercise—if its readings are treated as estimates with documented conditions, not a verdict on exposure or compliance.
This article is part of the computer hardware technology guide library.
How a Civilian Drone Particulate-Matter Sensor Supports Air-Quality Mapping
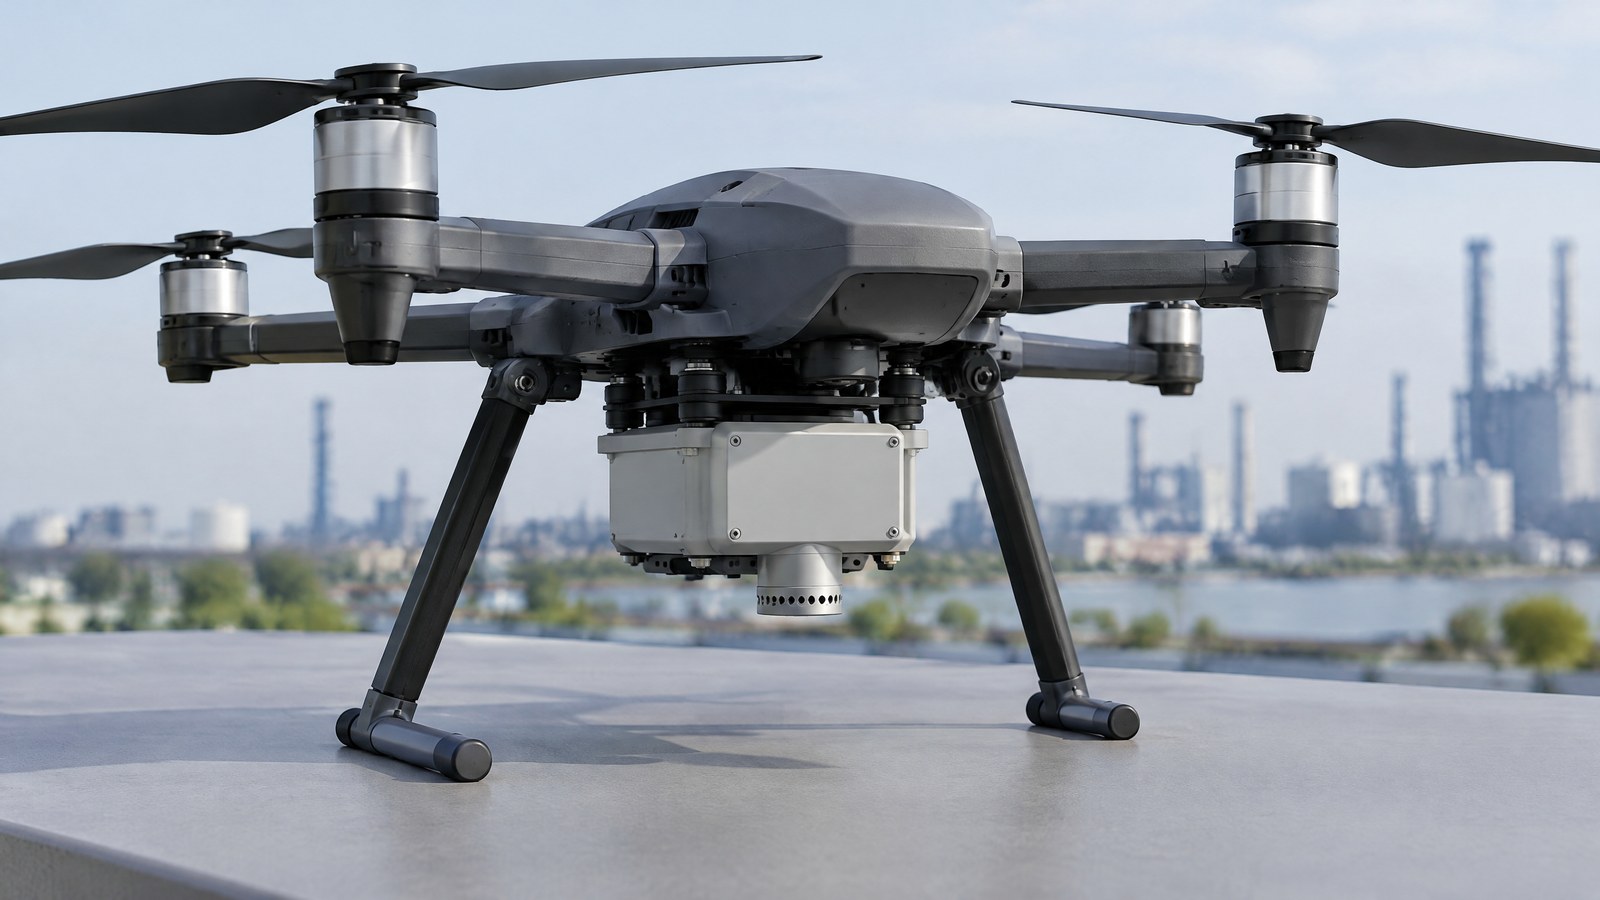
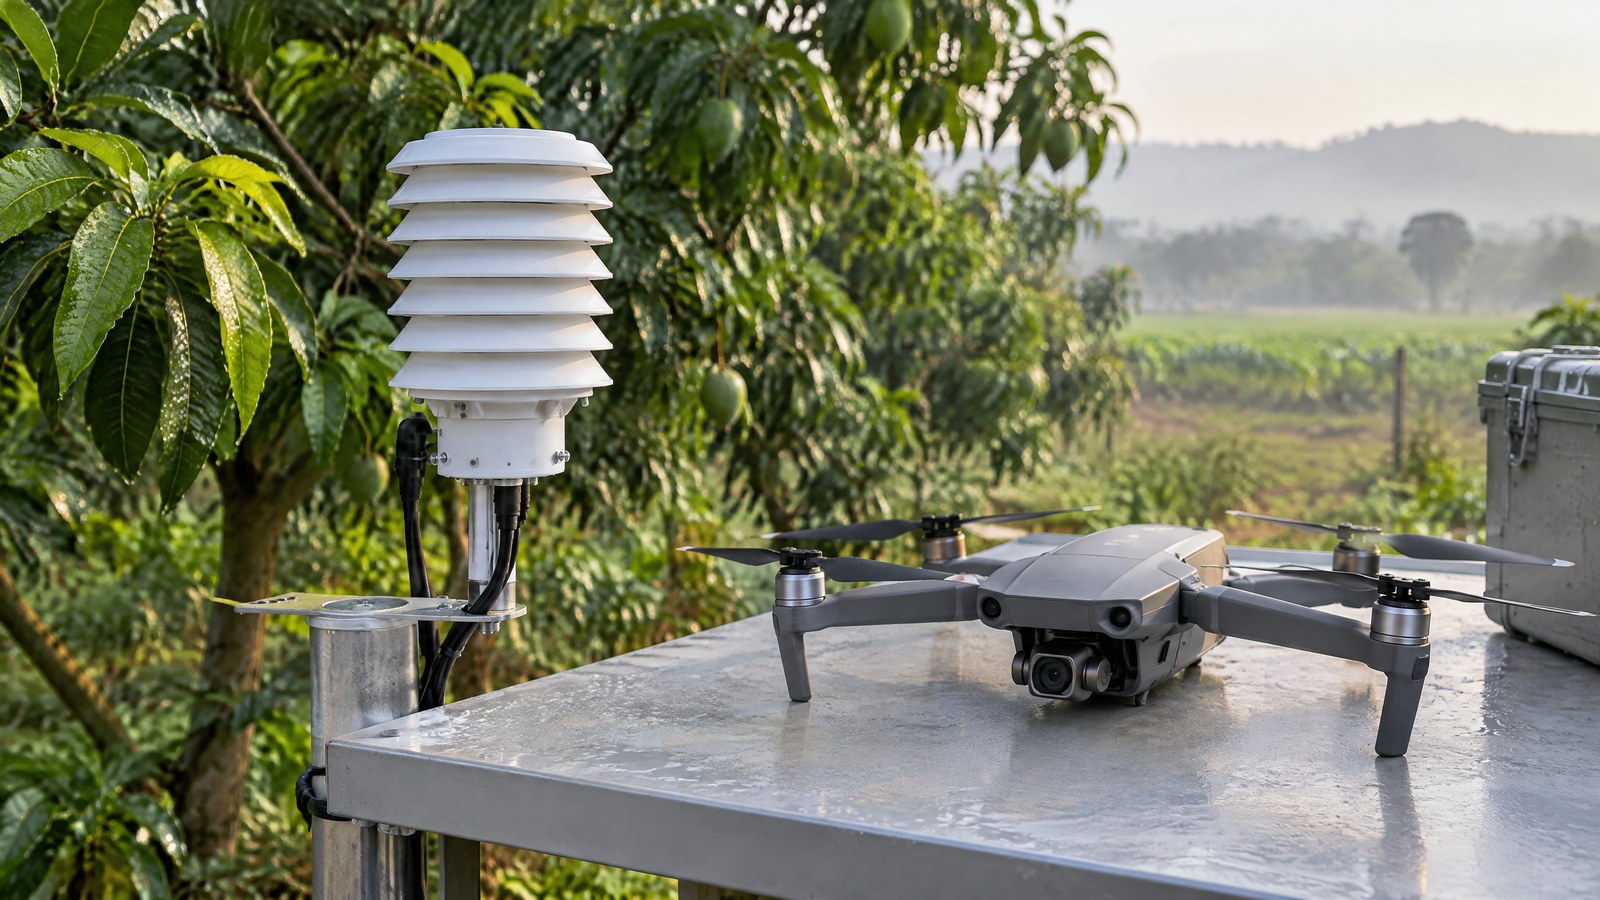
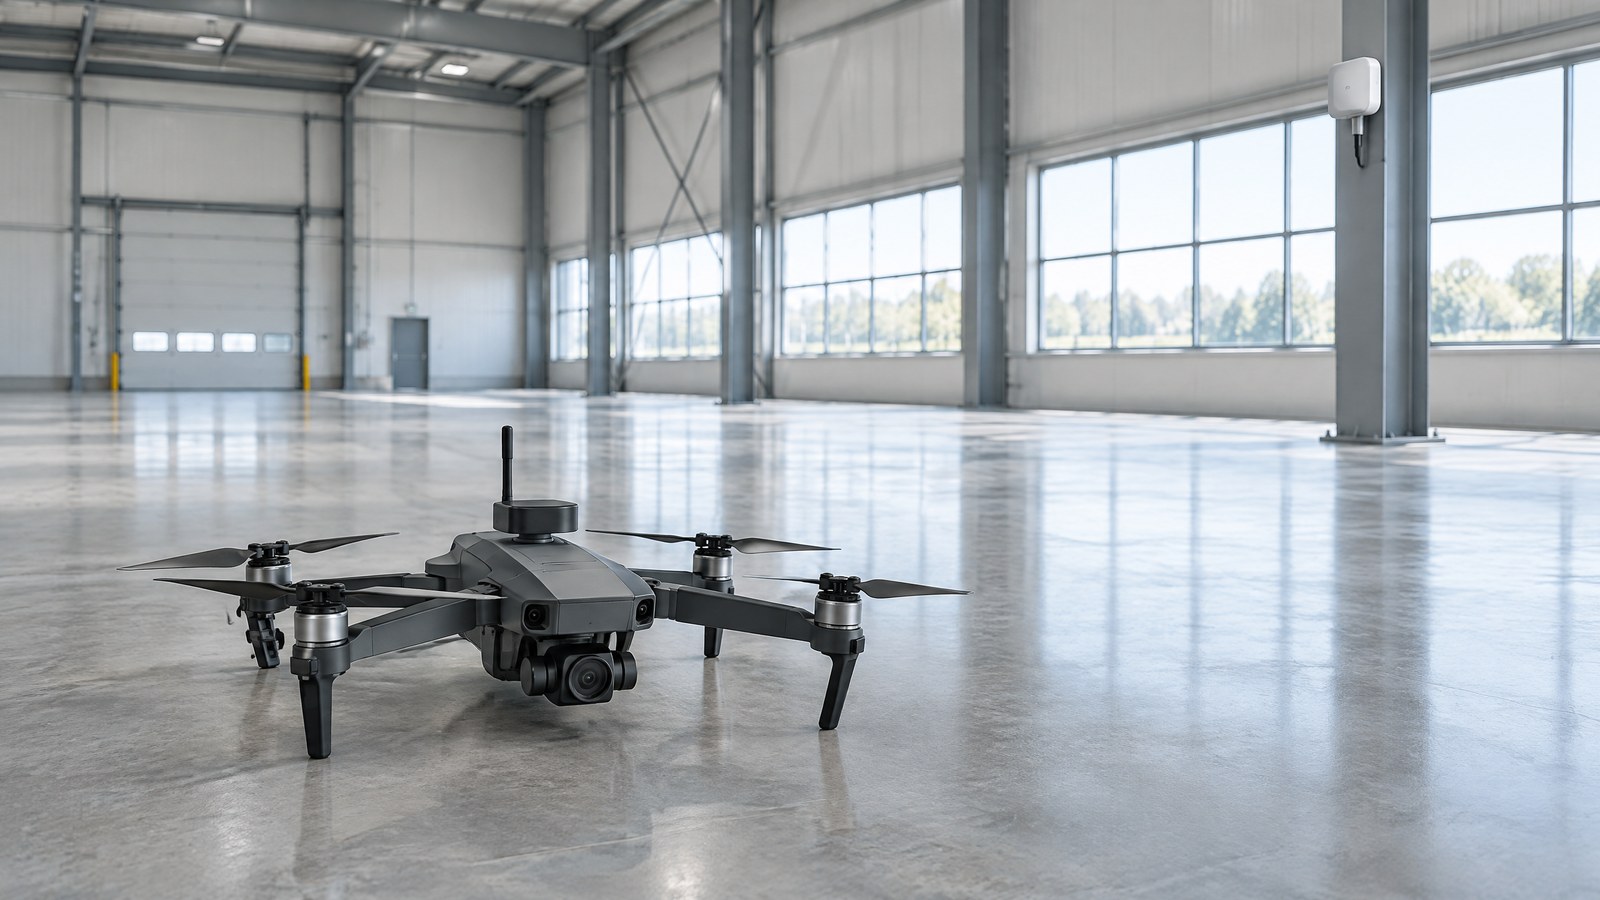
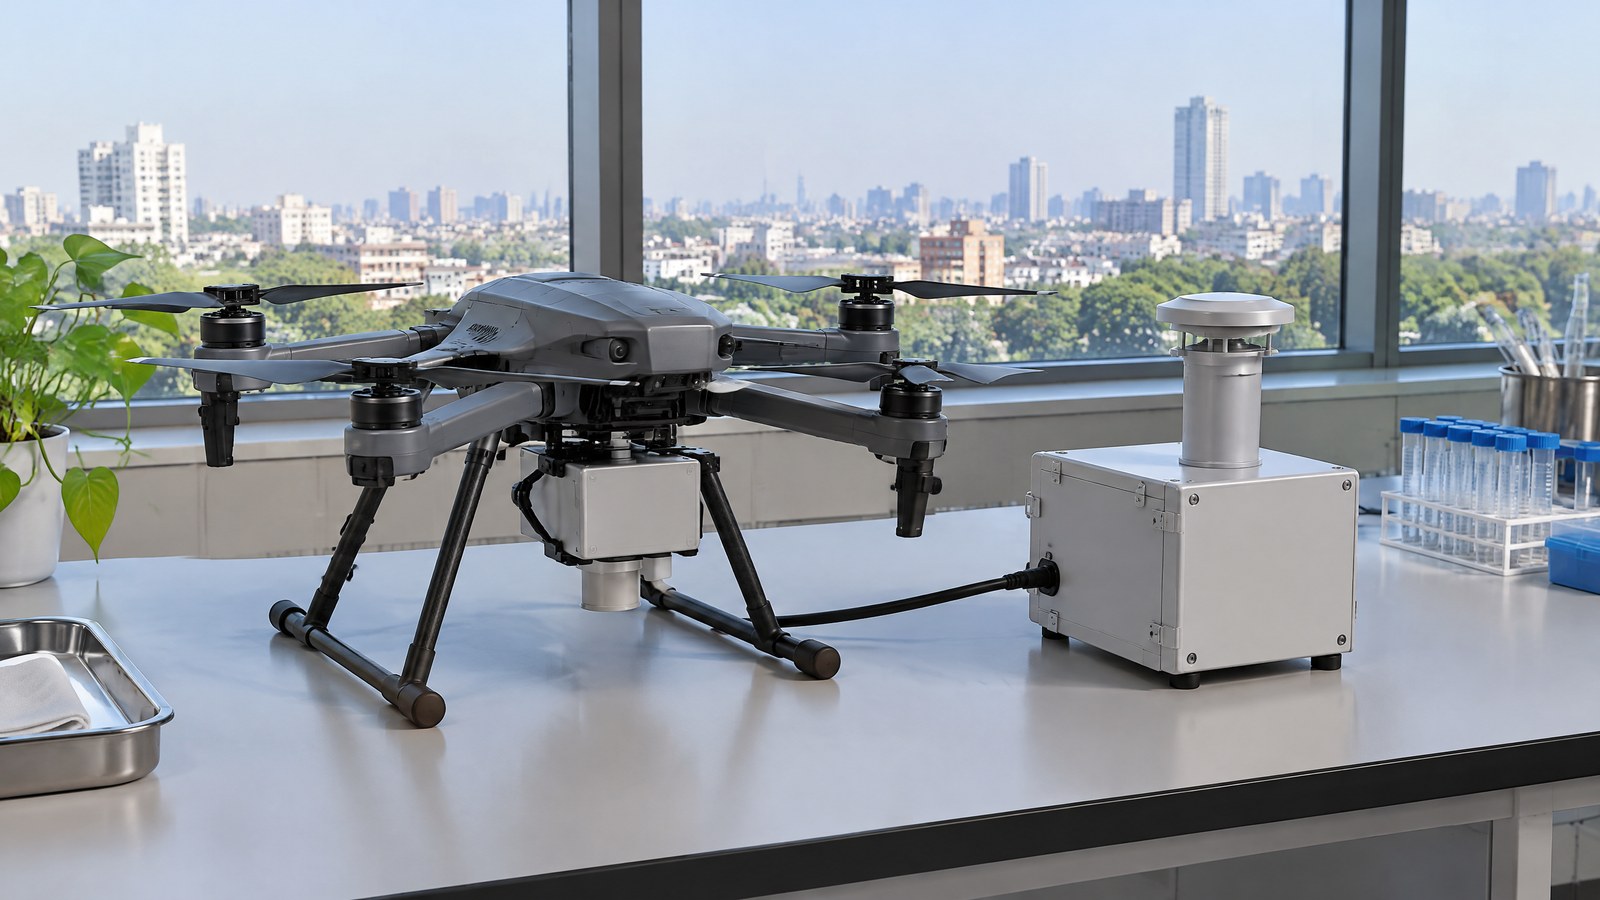
AI-generated editorial illustration of generic civilian drone hardware, not a photograph of a named product or an actual inspection.
This guide explains drone particulate matter sensor for air quality mapping basics for India-focused readers. The useful question is not whether a small airborne payload can produce a number; it is what that number represents, how it compares with other samples, and which limits must travel with the result. A PM payload can support environmental observation and research, but it does not identify every pollutant, prove a pollution source, replace qualified assessment or create permission to fly.
A drone PM payload is best understood as a mobile air-sampling instrument, not as a complete air-quality laboratory. It can collect observations at locations or heights that a fixed monitor does not occupy. The value is the context around each observation: when and where it was obtained, the particle fraction reported, the local weather and the sensor’s response characteristics. A map made from those samples is an interpretation of a limited set of points, not a photograph of every particle over a neighbourhood.
What the PM payload actually measures
Many compact particulate-matter instruments use optical particle counting or volume scattering. Particles entering the sensing region scatter light from an internal source; electronics use that response to count or size particles, or to estimate a mass concentration. The U.S. Environmental Protection Agency’s sensor-evaluation tables describe both approaches and show that some instruments convert particle counts across size designations into estimated PM2.5 and PM10 mass concentrations. [1]
That word “estimated” matters. PM1, PM2.5 and PM10 are particle-size-fraction labels, while a displayed concentration is the output of a particular optical system and its processing assumptions. The payload does not directly weigh every particle in the air. Nor does a PM channel identify whether particles came from a particular road, a construction activity, biomass smoke or another source. It also does not measure gases simply because it is carried by a drone.
For civilian UAV sensor education, distinguish the sensing element from the finished observation system. A real project may also have positioning and time records, environmental context, a data logger and a method for comparing readings. Those parts make individual samples interpretable, but they do not turn a low-cost PM signal into a reference-grade regulatory measurement.
Why an airborne sample can add a different view
A fixed monitor repeatedly describes the air at its own inlet. An airborne payload can instead contribute a series of samples at different reported locations or heights. That difference can be useful for investigating whether concentrations appear to vary through a shallow layer of air, across a site boundary or between repeated observation periods. The appropriate claim is modest: the payload observed a pattern under stated conditions. A single profile does not establish an area-wide average, personal exposure or a cause of the pattern.
Peer-reviewed work illustrates the potential and the boundary. Julaha and colleagues used a drone to examine vertical variation in particle number concentration and equivalent black carbon at urban and rural sites in the Czech Republic. Their results showed that concentration patterns could change with height and season. The work supports vertical profiling as an environmental research use; it is not Indian data and it does not make a general promise about any consumer drone or sensor. [3]
A useful air-quality map therefore preserves the difference between measurement and inference. Each point should remain tied to its sampling time, reported position or height, measurement duration or averaging basis, and relevant environmental notes. Smoothing lines or colour zones may help a reader see a pattern, but the visual treatment should never hide gaps between samples or make the result appear more certain than the observations allow.
Particulate-matter sensor limitations in flight
The particulate-matter (PM) sensor limitations are not limited to the chip or module. Humidity can change how aerosols behave optically, and inlet orientation, wind, particle composition and the sensor’s response time can change what reaches or is reported by the instrument. The EPA’s tables deliberately pair performance results with the test environment, reference monitor and averaging period. That is a useful discipline for readers: a result for one model in a stationary test is not a blanket accuracy claim for a mobile airborne payload. [1]
Rotor wash deserves the same caution. In a 2024 laboratory and field study involving a biomass-combustion source, Aurell and Gullett found that agreement between body- and arm-mounted PM2.5 measurements improved as data were averaged from one to ten seconds. They also explain that possible rotor-wash effects depend on the source, the sampler or sensor, meteorology and the sampling objective. Near a surface, air movement may stir particles; near a sharp plume, mixing can change a time-resolved measurement. The study is evidence for validating the specific measurement context, not a universal mounting rule. [2]
Humidity control was also material in the vertical-profiling research by Julaha and colleagues. In their specific equivalent-black-carbon comparison, readings without drying overestimated reference observations by 276% in summer and 285% in winter; a single-day dryer test reduced differences to under 10%, while the authors said multi-day validation remained a priority. Their optical particle-counter comparison also showed that orientation and wind could matter. Those figures should not be transplanted to PM2.5 readings in India. They show why temperature, relative humidity, wind and aerosol type belong in the interpretation record. [3]
Important Points / Key Information
The main consumer takeaway is simple: an airborne PM number is evidence about particles reaching one instrument in one set of conditions. It can be useful for comparative environmental observation when the project records enough context and does not overstate what the output means.
Key Takeaways
- A drone particulate-matter sensor usually uses optical response to estimate a particle count, size-related value or mass concentration; it does not directly identify every particle or all pollutants.
- The distinctive contribution of a civilian drone is mobile and height-specific sampling. It can reveal a pattern worth investigating, but it cannot by itself establish a source, personal exposure, a health conclusion or regulatory compliance.
- Humidity, wind, aerosol composition, sampling orientation, sensor response and rotor-induced air movement can affect the meaning of a reading. Model-specific validation and comparison to an appropriate reference matter.
- A positioning input or log can describe where a sample was taken, but it does not validate the PM measurement. Likewise, a Remote ID broadcast module is not the PM sensor itself.
- For any India operation, check the current official airspace information and other applicable requirements for the actual place and date; the payload does not confer operating permission.
A measurement record that supports careful comparison
A careful report states what was observed before suggesting why. It identifies the PM metric and units reported by the instrument, the model’s documented operating limits, the time basis of the value and the sample’s reported location or height. It also notes the weather or humidity context and whether the goal is repeated trend comparison, a vertical profile or a site-to-site observation. This is documentation, not a recipe for operating an aircraft.
If results are compared with a fixed monitor or another sensor, the comparison should name the devices, conditions and averaging periods. EPA describes comparison against a reference monitor under the same air-quality and weather conditions as a way to assess how accurate and reliable low-cost technologies are relative to traditional methods. A defensible comparison does not assume that two instruments displaying the same PM label use the same calibration or respond identically to the same aerosol. [1]
The result should carry its uncertainty forward. For example, a project can say that readings at reported sample points were higher during one documented observation period than another. It should avoid declaring a source responsible without source-specific evidence, extrapolating a few samples to all residents or presenting a mobile sensor estimate as an official compliance determination.
India: check airspace and permissions separately from sensor capability
A PM payload does not alter the legal status of a civilian drone operation. At the time of this research check, the Airports Authority of India’s DigitalSky platform described green, yellow and red airspace zones, provided an airspace map and zone-intersection check, and said flight-plan requests can be submitted online. It states that yellow-zone operations require permission from the concerned air traffic control authority and that red-zone operations require Central Government permission only. [4]
India’s Ministry of Civil Aviation 2022 backgrounder says the airspace map may be modified by authorised entities and advises people planning an operation to check the latest map. Because the location, date, aircraft, activity and rules can matter, readers should make a current official DigitalSky and DGCA check before an intended civilian environmental-mapping activity. This article is not operational or legal advice, and its sensor discussion does not replace pilot responsibility or any required professional assessment. [5]
Examples / Supporting Information
Research example — vertical variation: The 2025 Czech study measured particle number concentration and equivalent black carbon at more than one height in urban and rural settings. The reported seasonal and altitude-related differences demonstrate why a ground reading and a reading higher in the air need not match. The same study also demonstrates the limit: humidity treatment, inlet orientation and instrument comparison influenced results. It supports a question such as “how did the samples vary by reported height under these conditions?”, not a claim that all cities behave alike. [3]
Research example — time-resolved versus averaged data: The 2024 rotor-wash study found stronger agreement between two tested PM2.5 measurement locations when field data were averaged over a longer interval. This does not tell a civilian operator what configuration to use. It is supporting information for a narrower lesson: an instantaneous value and an averaged value can answer different questions, and sharp gradients near a source can be sensitive to airflow and response time. [2]
Hypothetical India-facing example — clearly illustrative, not a reported deployment: an environmental group compares repeated airborne PM observations above two publicly permitted areas on different days. Its cautious public chart labels the timestamp, reported height, sensor model, PM metric and humidity context beside each group of samples. It says the observations suggest a pattern worth further investigation, while declining to name a source, estimate individual exposure or call any reading a compliance result. That is more informative than presenting one unqualified number as a city-wide answer.
Conclusion
A drone particulate-matter sensor for air quality mapping can make an otherwise unseen part of the atmosphere observable: particles sampled at a stated place, time and height. That is a worthwhile civilian environmental use when the output is read as an optical estimate with limits, rather than as proof of a source, safety verdict or regulatory status.
The strongest reports keep the context attached to the number. They explain the PM metric, document the sensor and conditions, distinguish findings from inferences, and acknowledge humidity, wind, aerosol and mobile-sampling effects. In India, they also separate a measurement idea from the current official airspace and permission check. Used this way, the payload can contribute careful evidence to a broader assessment without claiming more certainty than it has earned.
Source notes
Reporting record
techduopulse stores source destinations privately. Public notes remain non-clickable so every visitor journey stays on this website.
Optical particle-counting and volume-scattering principles; device-specific performance context, reference comparisons and averaging periods
Primary source · What the PM payload actually measures; Particulate-matter sensor limitations in flight; A measurement record that supports careful comparisonField and laboratory evidence on UAS rotor wash, PM2.5 averaging and context-specific sampling limits
Primary source · Particulate-matter sensor limitations in flight; Examples / Supporting InformationDrone-based vertical profiling findings and humidity, orientation and wind-related measurement limitations
Primary source · Why an airborne sample can add a different view; Particulate-matter sensor limitations in flight; Examples / Supporting InformationCurrent platform information on airspace zones, permissions, map, intersection check and online flight-plan requests
Primary source · India: check airspace and permissions separately from sensor capabilityGovernment backgrounder on the Drone Rules, airspace-map categories and the need to check the latest map
Primary source · India: check airspace and permissions separately from sensor capabilityInitial civilian drone-sensor explainer; sources and AI-generated illustrative imagery reviewed before publication.