A wind-speed sensor, often called an anemometer, turns moving air into a measurement that can make a farm weather station, water-side site or forecast display easier to interpret. The useful question is not only how fast the cups or acoustic signals respond, but what that reading represents at its exact location and time.
On this page 8 sections
- How a Wind-Speed Sensor / Anemometer Works
- Why Gusts, Averages and Height Change the Answer
- Exposure: The Measurement Includes Its Surroundings
- Reading a Local Anemometer in India
- Local Anemometers and Satellite Ocean-Wind Retrieval Are Different Observations
- Important Points / Key Information
- Examples / Supporting Information
- Conclusion
Part of our emerging technology science guide library
How a Wind-Speed Sensor / Anemometer Works
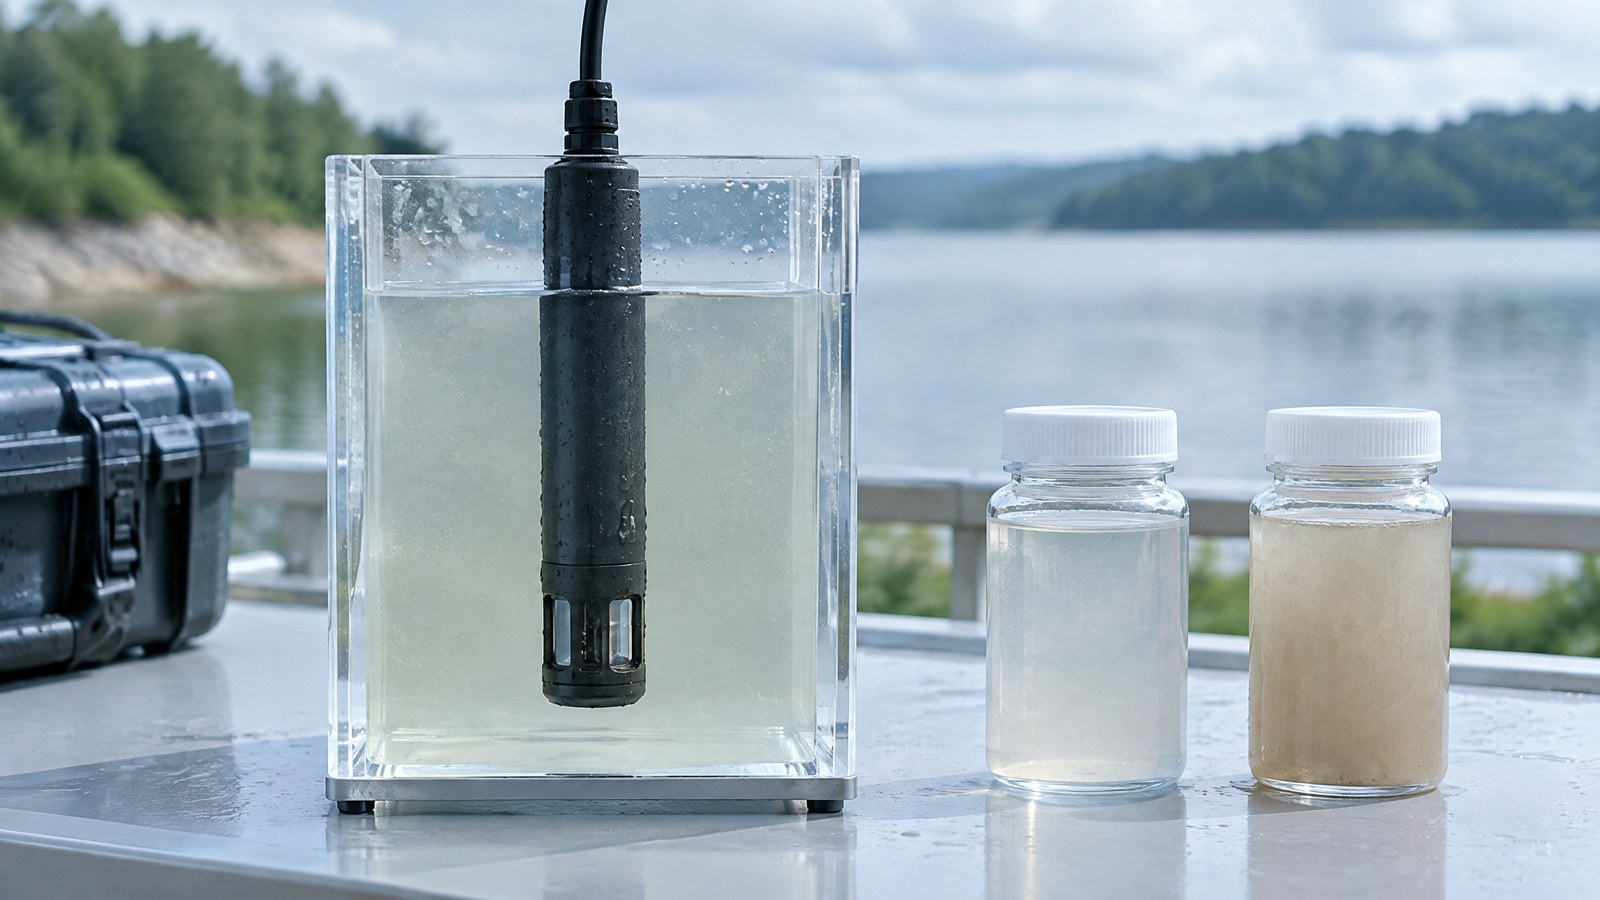
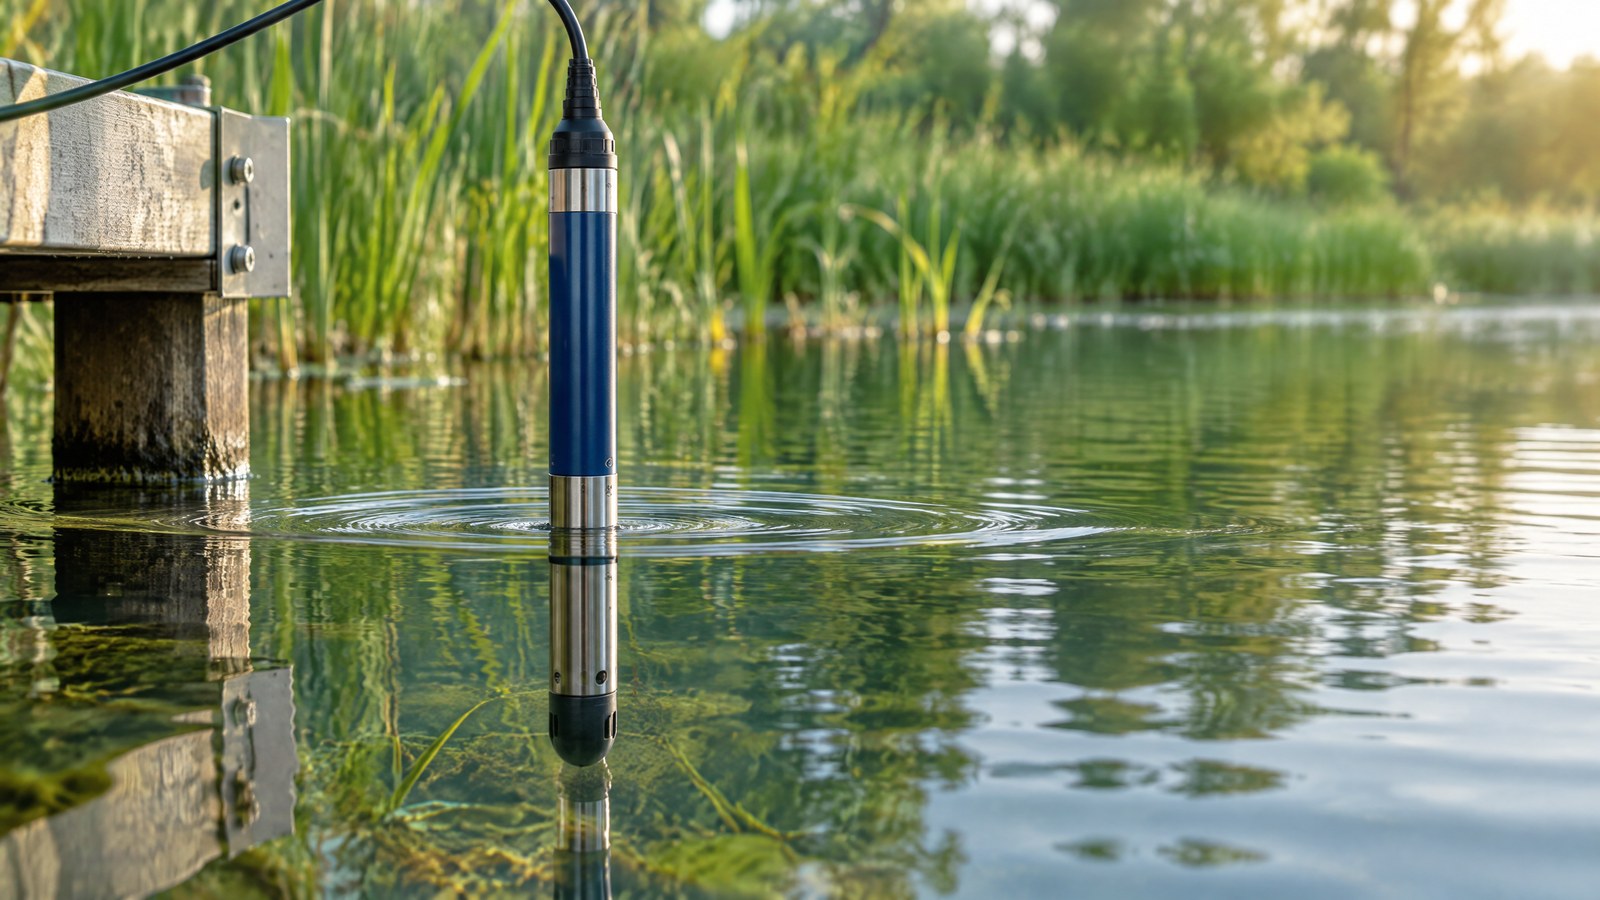
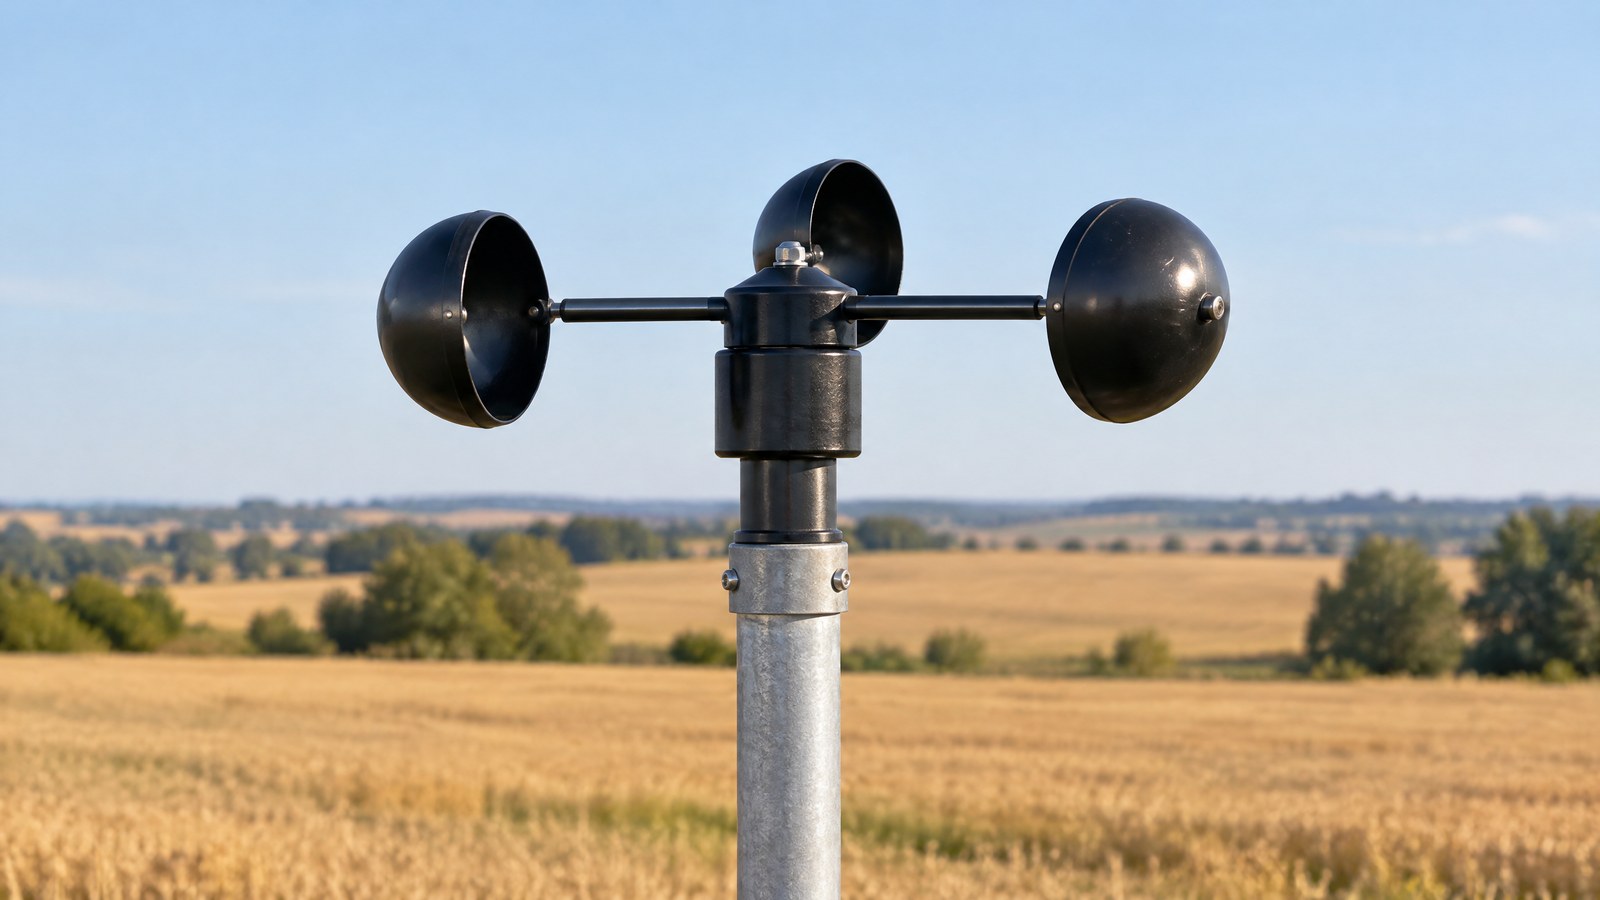
AI-generated editorial illustration of generic wind-measurement hardware in an open weather-station setting, not a photograph of a tested product or an actual field measurement.
An anemometer is the part of a weather-observing setup that senses wind speed; a separate wind vane, or a combined instrument, may add direction. A number on a display is therefore a local observation of moving air at the sensor, rather than a universal description of conditions across a whole district. The Met Office notes that anemometers can record speed, direction and gust strength. [1]
Cup anemometers turn rotation into a speed reading
The familiar cup anemometer has three or four cups around a vertical spindle. Air pushes the cups, the spindle turns, and the instrument converts the turning rate to wind speed using its calibration relationship. Because cups rotate around a vertical axis, the sensor can respond to wind arriving from different horizontal directions; direction itself still needs a vane or another directional method. [1]
This design is easy to recognise on a weather mast. Its practical reading is not simply “how much wind exists”: it is a time series of rotation translated into speed at that mast’s height and exposure. Mechanical parts, their response to changing wind and their calibration history can all affect how closely the displayed value represents the air flow at the sensing point. NOAA guidance similarly treats cup or propeller anemometers with wind vanes as convenient instruments for averaged wind speed and direction. [4]
Propeller anemometers need a facing direction
A propeller anemometer uses a small rotor whose axis is intended to face the incoming air. It is commonly paired with a tail or vane so the rotor can align with the flow. That geometry makes it useful for measuring a wind component along the propeller axis, while the vane supplies directional context. Like a cup sensor, it is a local instrument: a nearby wall, tree, roof edge or vehicle can alter the flow reaching it.
A propeller’s value should not be confused with a vehicle speed reading. A moving car creates airflow around itself, so its surroundings are not the same as a stationary weather-station exposure. For a car owner reading a weather app, a reported wind value is best understood as an observation from a particular station, not a measurement made at every roadside point.
Ultrasonic anemometers use sound rather than moving cups
An ultrasonic, or sonic, anemometer has transducers that send acoustic signals between one another. Wind changes the travel time depending on whether it assists or opposes the sound along a path. Combining paths can provide wind speed and direction without a spinning rotor. The Met Office uses this approach at some exposed sites and notes that the supporting structure can distort airflow, so calibration-based corrections may be needed. [1]
No moving cups does not mean no measurement limits. Rain, contamination, mounting geometry, electronic processing and the disturbed air around supports can matter to a particular instrument. The sound method and the cup method are different ways of observing the same local atmosphere; their data should be compared only with their height, averaging period and exposure in view.
Why Gusts, Averages and Height Change the Answer
Wind is not steady, so one honest wind report needs more than a single peak number. A mean describes conditions over a stated interval, while a gust identifies a short-lived stronger episode within a reporting interval. The Met Office defines a gust as the maximum three-second average wind speed in a period and describes a ten-minute average as a measure of overall wind intensity in its observing practice. [1]
A gust is not the same as the average wind
Imagine a display that shows a moderate recent average and a much higher gust. That does not necessarily indicate a faulty anemometer: the two values answer different questions. The average smooths short changes over its stated window, while the gust retains a brief peak. A reader comparing apps, stations or logs should first check whether each value is a gust, a short average or a longer average. Numbers without that context are easy to over-interpret.
Height is part of the measurement description
Wind commonly changes with height and is shaped by surface roughness and nearby obstructions. [1] That is why a value from a roof edge, a farm mast and a buoy should not be treated as interchangeable just because all are labelled wind speed. NOAA’s National Data Buoy Center keeps the raw speed measured by the station anemometer and also provides wind speeds adjusted to a 10-metre reference height for marine comparison. [2]
The important lesson is not to apply a universal correction to a home or farm reading. It is to retain the observation context: where the sensor was, how high it was, whether the value is raw or adjusted, and over what interval it was summarised. Those details let a qualified reader decide whether two observations can sensibly be compared.
Exposure: The Measurement Includes Its Surroundings
A wind sensor measures the air that reaches it, and the route air takes to reach it can be altered by its surroundings. Buildings, trees, terrain and the roughness of the ground can slow, channel, accelerate or make the nearby flow turbulent. The Met Office describes an ideal open exposure as level ground with uniform roughness and no large obstacles within 300 metres of the tower, while also acknowledging that real observing sites are seldom ideal in every wind direction. [1]
Obstructions can create a locally real but non-representative reading
A low reading behind a wall may accurately describe the sheltered pocket behind that wall, but it may not describe an open field nearby. Conversely, air accelerating around a roof corner can produce a local peak that is not representative of the broader area. This is why an anemometer should not be treated as a direct measure of regional weather, a building’s safety condition or a car’s driving environment.
For scientific records, exposure is metadata rather than an afterthought. NOAA shipboard guidance stresses the need to minimise flow distortion around wind sensors and to document sensor location and objects that may affect exposure. [4] The same reasoning applies on land: a useful record states the site context instead of treating the instrument number as self-explanatory.
Reading a Local Anemometer in India
In Indian agriculture and weather-monitoring contexts, a local wind reading can help describe conditions at a specific plot, pond edge, rooftop or small weather station. It can be useful alongside temperature, humidity, rainfall and a stated time window when a trained user is interpreting local conditions. It does not, by itself, forecast a storm, certify water quality, prove that a crop or fish stock is safe, or replace official warnings and qualified advice.
Compare like with like before drawing a conclusion
A reader in an open agricultural area might compare the same station’s recent averages across similar time windows to see how local airflow is changing. A reader near a water body might note that an exposed shoreline sensor and a sheltered garden sensor describe different micro-environments. These are observation examples, not tests, prescriptions or universal decision thresholds.
When conditions may affect people, transport, crops, water operations or property, use authoritative local forecasts and warnings rather than a single consumer sensor reading. A local anemometer is one observation with a documented context; it is not a stand-alone safety system.
Local Anemometers and Satellite Ocean-Wind Retrieval Are Different Observations
A mast-mounted anemometer samples air at one physical location. A satellite scatterometer does not have cups turning in the sea breeze; it sends radar energy toward the ocean surface and retrieves ocean-surface wind-vector products from the radar backscatter using processing models. NASA describes a long-running record built by cross-calibrating retrievals from several scatterometers, including ISRO’s ScatSat-1 OSCAT instrument. [3]
A satellite product has broad coverage, not a yard-level reading
NASA’s project documentation describes wind and wind-stress products on satellite swaths and grids, with time coverage determined by the instruments in the record. [3] Such data are valuable for ocean and weather research, but they are not a replacement for a specific local anemometer beside a farm, harbour, road or water tank. Their sensing method, spatial coverage, processing and reference context differ.
The useful comparison is therefore not “which one is the real wind?” but “what part of the atmosphere or ocean surface did each system observe, by what method, and for what time and area?”
Important Points / Key Information
A useful wind value should retain its unit, averaging window, whether it is a gust or mean, sensor height when known, and any adjustment noted by the data provider. Without these labels, a comparison can sound more certain than the underlying observations allow. [1] [2]
Exposure is not merely an installation detail. It determines whether a reading is most representative of an open field, a sheltered courtyard, a rooftop edge, a buoy’s height above water or another micro-location. Documenting it makes the observation more useful and discourages inappropriate comparison. [1] [4]
- A wind-speed sensor records air flow at its own location, height and exposure, not a single value for an entire region.
- Cup, propeller and ultrasonic anemometers use different sensing mechanisms, but all need an interpretable site context.
- A gust, an average and an adjusted reference-height wind speed are different reported quantities and should not be compared as if they were identical.
- Satellite scatterometers retrieve broad ocean-surface wind products; they are not local ground-anemometer substitutes.
Examples / Supporting Information
Hypothetical: two nearby displays can disagree for a sound reason
Consider two hypothetical sensors in the same Indian town: one is in a relatively open agricultural plot and another is beside a multi-storey building. If their readings differ, the first question is not which device “wins.” A better first question is whether the site exposure, sensor height and averaging window differ. Airflow altered by obstacles can make both readings locally meaningful while preventing a direct like-for-like comparison. [1]
Source-backed example: standardising marine reference height
NOAA’s National Data Buoy Center explains that buoy and coastal-station anemometers can sit at different heights, and that it provides derived wind speeds standardised to a 10-metre reference level for comparison while preserving the actually measured station values. [2] This example shows why a height label matters: the reported number may be an observation at the instrument or a modelled adjustment to a stated reference height.
Source-backed example: ScatSat-1 in a satellite wind record
NASA’s MEaSUREs ocean-surface-vector-wind project includes a ScatSat-1 data set among records from four scatterometers and describes the OSCAT instrument as a conically scanning Ku-band scatterometer. [3] It is an India-relevant example of satellite remote sensing, but it should be read as a processed ocean-surface product with its own coverage and retrieval method—not as a cup-anemometer observation at a local land station.
Conclusion
A wind-speed sensor or anemometer is most useful when its number stays attached to its method, height, exposure and averaging period. Cup, propeller and ultrasonic instruments can each provide valuable local observations, while satellite scatterometers serve a different ocean-scale retrieval role. This educational article is not a substitute for official weather warnings or professional assessment.
How we checked thisSources (4)
We keep source links private so your reading stays on techduopulse. Each note names the publisher and document we checked.
Met Office explanation of local wind measurement, gusts and exposure
Primary source · Mechanism, gusts and exposureNOAA explanation of measured and reference-height marine wind values
Primary source · Height and comparisonNASA description of satellite ocean-surface wind-vector products
Primary source · Satellite ocean-wind retrievalNOAA guidance on averaged mechanical wind sensors and exposure metadata
Primary source · Mechanical sensors and exposureOwner-approved educational sensor explainer; obsolete private-draft status removed without changing source-backed facts or professional safety boundaries. Original generic AI editorial illustration, not a product or field-test photograph.