Water can look clear, tea-coloured, silty or suddenly cloudy, but the useful question is not simply what it looks like: it is what the optical reading can support. A turbidity sensor helps track how suspended material changes the way light moves through water, provided its method, units and limits stay attached to the number.
On this page 4 sections
Part of our emerging technology science guide library
How a Turbidity Sensor Turns Scattered Light into a Reading
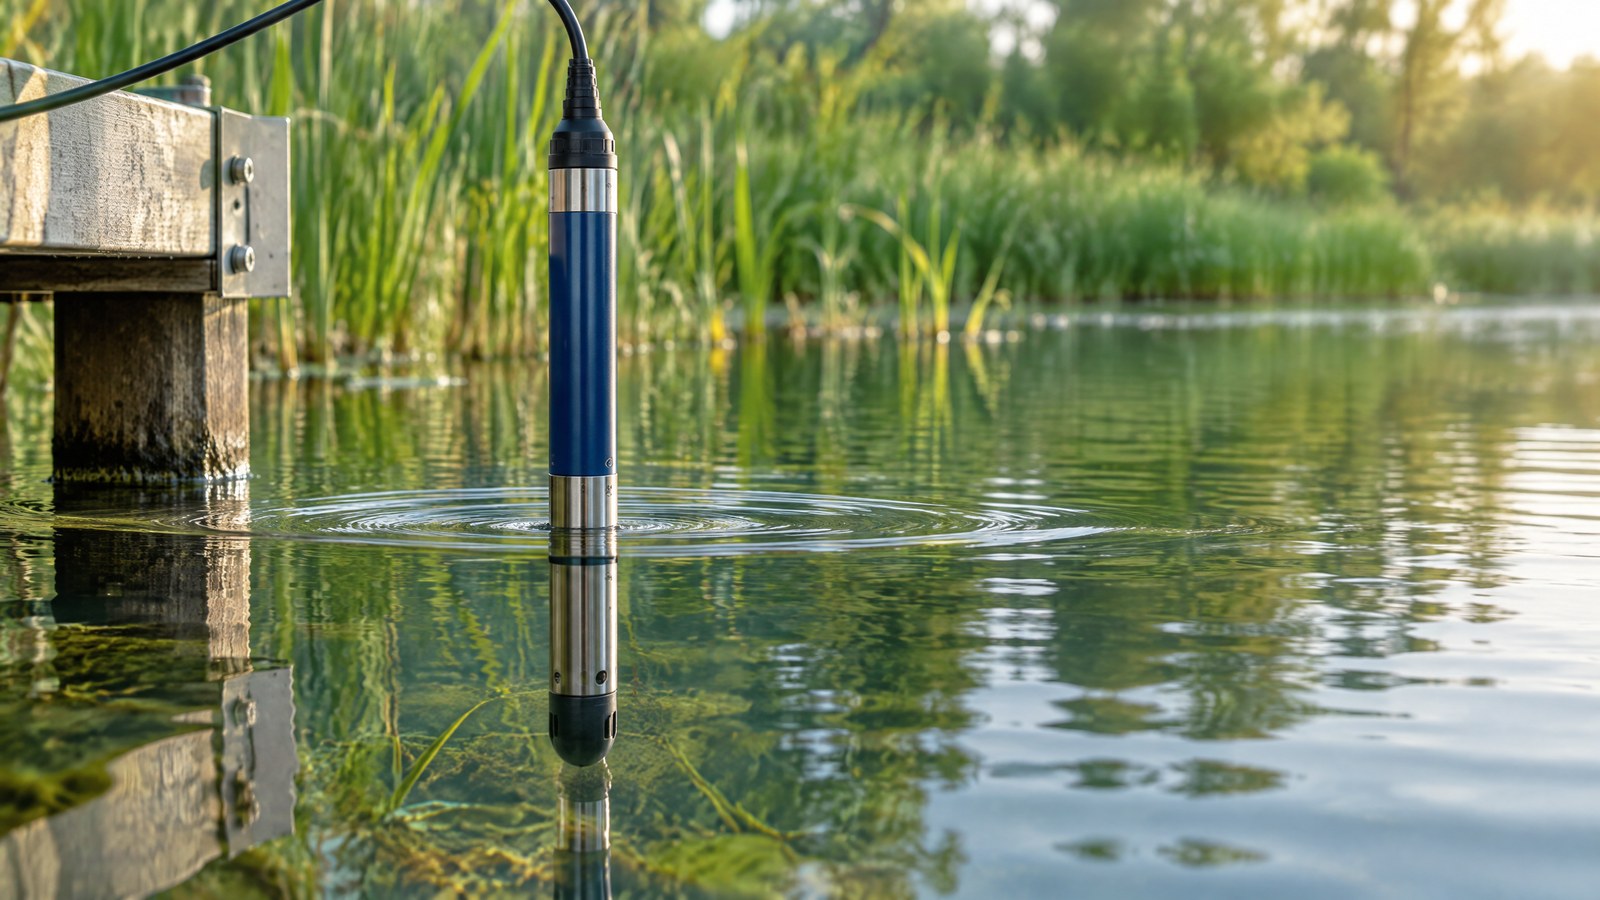
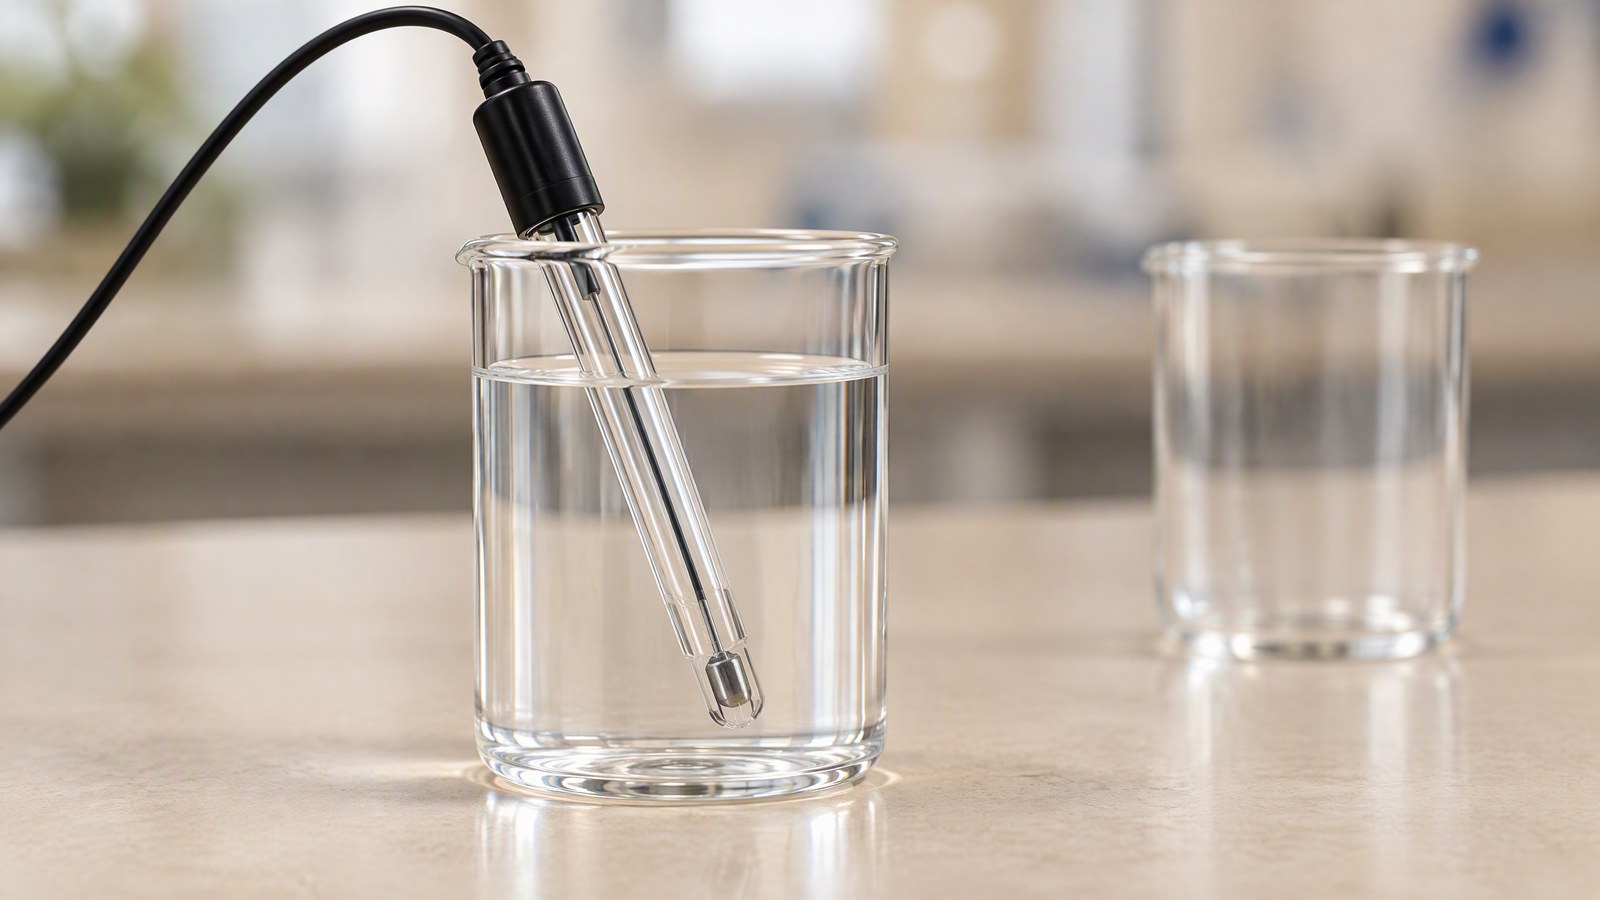
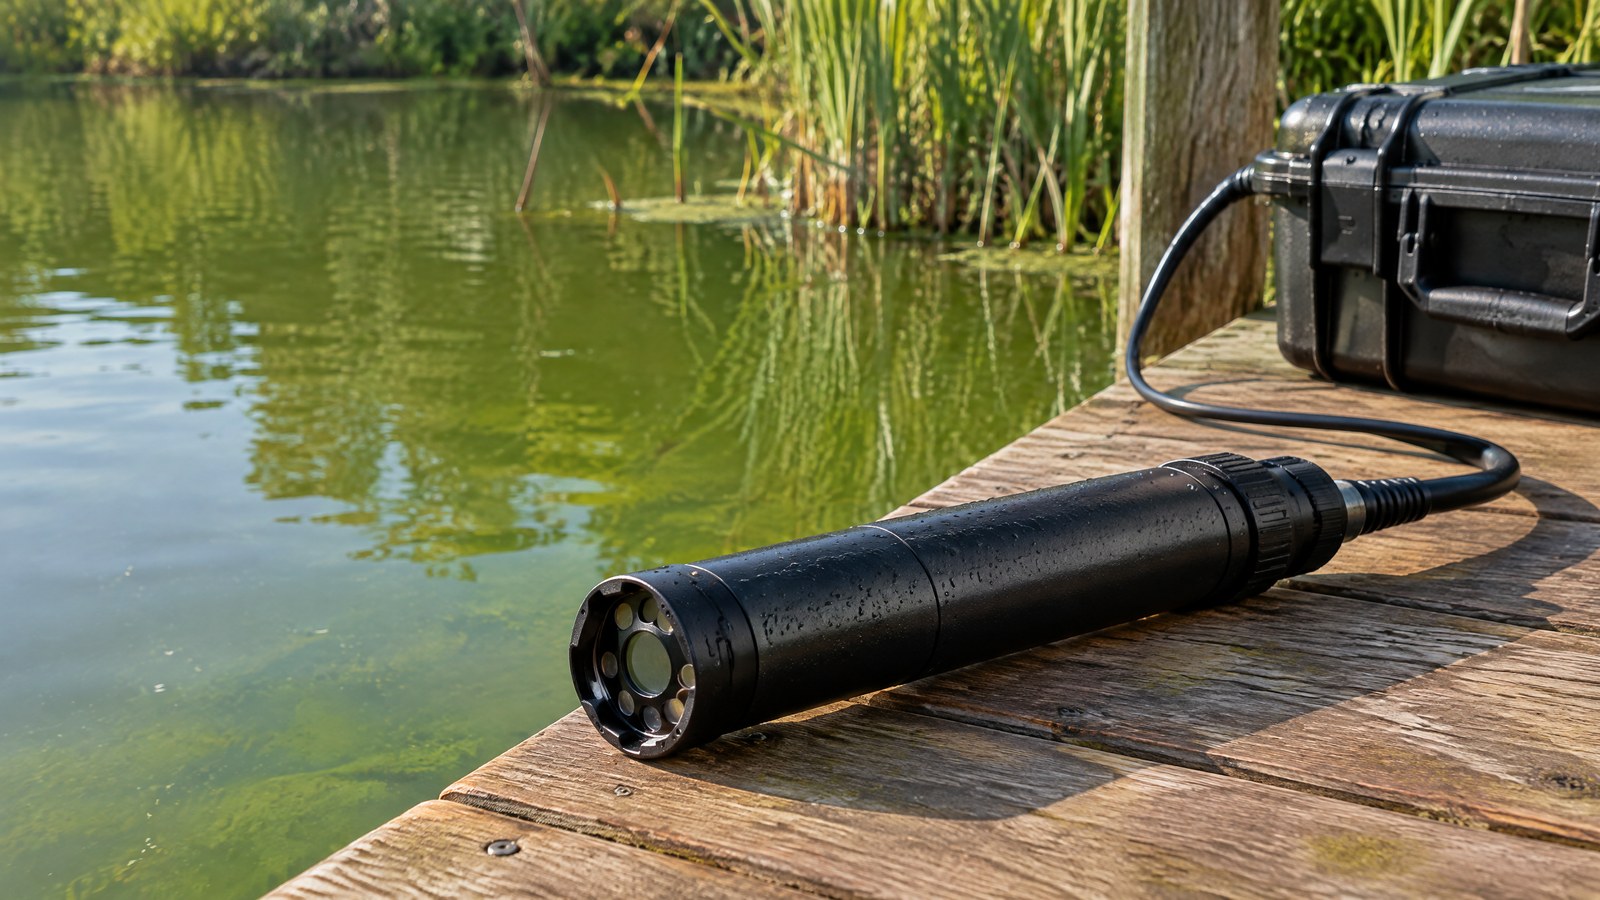
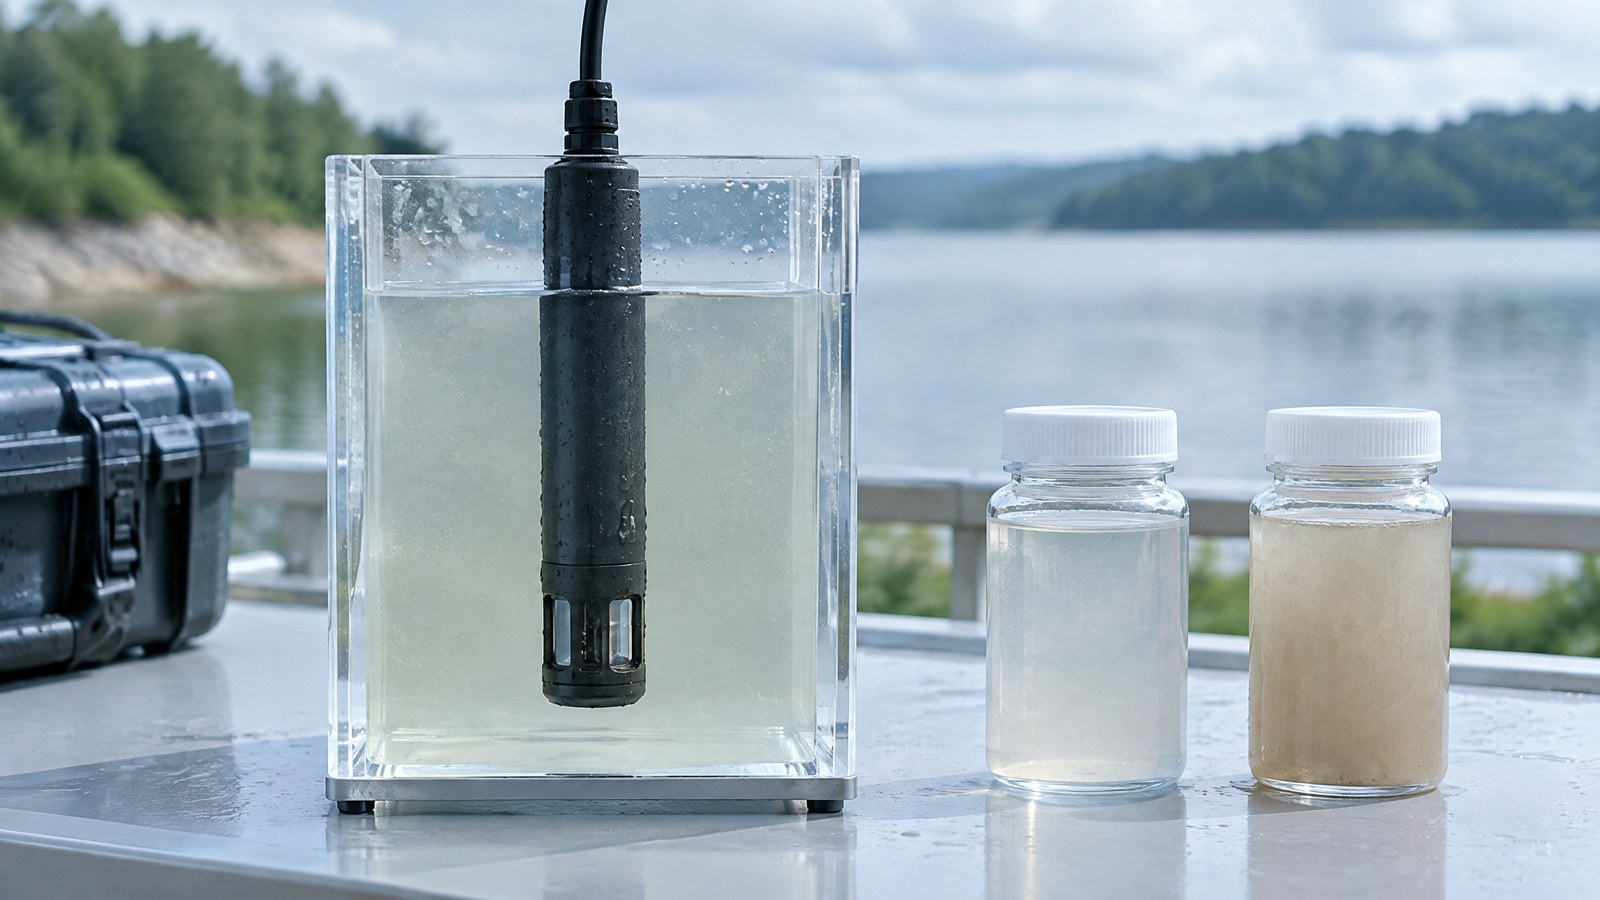
AI-generated editorial illustration of generic turbidity-sensor hardware in a water-monitoring setting, not a photograph of a tested product or an actual field measurement.
A turbidity sensor is an optical instrument. It sends light into a water sample or surrounding water and examines light that particles scatter, absorb or redirect. The measurement describes the collective optical effect of material in the water; it is not a direct weigh-in of every particle. The USGS lists contributors that can include clay, silt, fine organic or inorganic matter, algae, plankton and dissolved coloured organic compounds. [1]
That distinction matters because two samples with the same mass of material can scatter light differently. Particle size, shape, colour, reflectivity and how the material is distributed all influence the optical response. A reading is therefore most informative when it is treated as a repeatable measurement for a stated method and site, rather than as a universal description of cleanliness.
Cloudiness is an optical signal, not a particle count
Turbidity is commonly described as relative clarity or cloudiness, but the technical idea is more precise: light that would otherwise travel straight through water is scattered and sometimes absorbed. In a nephelometric arrangement, a detector looks at scattered light from the side of the light beam. The stronger the defined scattered-light signal, the higher the reported turbidity for that instrument and method. [2]
This is why turbidity should not be converted casually into suspended-sediment concentration, a count of microbes, or a list of contaminants. The USGS National Field Manual explicitly describes the measurement as qualitative and says it cannot be correlated directly with micrograms per litre of suspended solids. [1] A sediment laboratory result, a microbial test and a chemical analysis answer different questions from a cloudiness sensor.
Detector geometry decides what the instrument sees
Nephelometers detect scattered light at a specified angle, commonly 90 degrees from the incident beam. EPA Method 180.1 describes comparison with a reference suspension under defined conditions and specifies a detector centred at right angles to the light path. [2] The standardisation is important because an optical value is meaningful only relative to its optical design and reference approach.
Other designs look along the beam for loss of transmitted light, often called attenuation, or look close to the light source for backscatter. A manufacturer technical guide explains that these arrangements have different detector positions and can be suited to different measurement ranges. [5] The key reader insight is not that one arrangement is always better; it is that changes in source, wavelength, angle, path length and processing can change the number an instrument reports.
NTU, FNU and method identity travel together
NTU means nephelometric turbidity units. It is widely used for readings from nephelometric instruments, including the white-light, 90-degree configuration described in EPA Method 180.1. [2] FNU, or formazin nephelometric units, is associated with an infrared, 90-degree approach commonly discussed with ISO 7027. The USGS field manual also notes FTU for an absorptometric method and records that older units exist. [1]
The label beside a result is not decoration. A published or shared value should retain the method, unit, instrument configuration where available, calibration context, sampling location and time. An In-Situ technical explanation notes that differing instrument designs can yield values that are not necessarily analogous, even when people use similar-sounding unit labels. [5] Comparing a trend from the same validated setup is usually more defensible than treating values from unlike devices as interchangeable.
What can distort a turbidity reading
A sensor sees light, so it can be misled by things that change the light path without representing the condition a reader assumes. EPA Method 180.1 identifies fine air bubbles as a possible high-reading interference. It also notes that floating debris and coarse material that settles rapidly can produce low readings, while true colour from dissolved substances and strongly light-absorbing material can also bias results low. [2]
Fouling on an optical window, scratches or fingerprints on a sample cell, ambient light, sensor drift, rapid settling and non-representative sampling can each reduce confidence. These are not reasons to ignore a reading; they are reasons to record conditions, look for an unexplained change and have qualified water-monitoring personnel assess the instrument and the wider evidence. A single reading is a prompt for context, not a complete diagnosis.
Important Points / Key Information
Key Takeaways
- A turbidity sensor measures an optical response caused by material that scatters or alters light; it does not identify every substance in the water.
- The method matters. Light source, detector angle, optical path and calibration reference affect how a value should be interpreted.
- NTU, FNU and other turbidity labels are method-specific context, not interchangeable proof of the same physical amount of material.
- A low or high turbidity value alone does not certify drinking-water safety, sterility, absence of toxins or aquatic health.
- Use turbidity as one monitored indicator alongside the appropriate sampling, process records and professionally interpreted tests.
Examples / Supporting Information
The most useful examples are about change and context, not a magic safe number. In a hypothetical India-focused river or reservoir monitoring scenario, a sharp rise after intense rainfall may show that more light-scattering material is present in the water. The USGS explains that runoff can carry particles into rivers and that faster, higher flows can stir material from the streambed. [3] The result could justify closer investigation of catchment conditions or sampling plans, but it would not identify the material by itself.
In a water-treatment setting, turbidity can be an operational indicator rather than a stand-alone safety verdict. WHO says turbidity can offer rapid information for monitoring controls, but also cautions that the relationship between turbidity removal and pathogens is not directly proportional or uniform across supplies. [4] That is why a cloudiness result cannot replace microbial testing, verified treatment performance, or the locally applicable oversight framework.
For irrigation reservoirs, fish ponds or farm water storage, a turbidity trend can be relevant to light penetration and suspended matter. It does not establish water suitability for crops, livestock, fish or people. Qualified professionals may combine it with the site’s stated purpose and other measurements, rather than using a generic online threshold as a treatment prescription.
A comparison between two devices is also an example of where context protects against overclaiming. If one instrument uses an infrared 90-degree nephelometric method and another uses a different optical arrangement, identical-looking numbers need not mean identical water conditions. Record the method before deciding that one source changed more than another.
Conclusion
A turbidity sensor is valuable because it turns a visible but subjective impression of cloudiness into a traceable optical measurement. Its real value comes from interpreting the result with the measurement method, site conditions and complementary evidence—not from treating NTU or FNU as a universal measure of sediment, microbes or safe drinking water.
For water-supply, environmental, agricultural or aquaculture decisions, seek guidance from qualified specialists before using this information in a safety-sensitive workflow.
How we checked thisSources (5)
We keep source links private so your reading stays on techduopulse. Each note names the publisher and document we checked.
USGS National Field Manual explanation of turbidity and method-specific units
Primary source · How a Turbidity Sensor Turns Scattered Light into a Reading; NTU, FNU and method identity travel togetherEPA Method 180.1 explanation of nephelometric measurement and optical interferences
Primary source · Cloudiness is an optical signal, not a particle count; Detector geometry decides what the instrument sees; What can distort a turbidity readingUSGS explanation of runoff, suspended material and turbidity in rivers
Primary source · Examples / Supporting InformationWHO technical brief on turbidity as a water-safety operational indicator
Primary source · Examples / Supporting InformationManufacturer technical guide to optical turbidity sensor geometries and method labels
Secondary source · Detector geometry decides what the instrument sees; NTU, FNU and method identity travel togetherOwner-approved educational sensor explainer; obsolete private-draft status removed without changing source-backed facts or professional safety boundaries. Original generic AI editorial illustration, not a product or field-test photograph.