A solar-radiation sensor, commonly called a pyranometer, turns the sunlight and sky radiation reaching a chosen surface into a number that can be compared over time. The useful question is not simply how sunny a place feels, but what irradiance reached a stated receiving plane, in which units, and with which sensor response.
On this page 9 sections
- What a Solar-Radiation Sensor / Pyranometer Measures
- How Thermopile and Silicon Designs Create a Reading
- Why the Receiving Plane Matters
- A Pyranometer Is Not a Lux Meter or a PAR Sensor
- What Can Change a Reading Before It Becomes Useful Evidence
- India Context: Describe Conditions Before Drawing Conclusions
- Important Points / Key Information
- Examples / Supporting Information
- Conclusion
Part of our emerging technology science guide library
What a Solar-Radiation Sensor / Pyranometer Measures
A pyranometer measures solar irradiance: radiant power arriving per unit area on its receiving surface. The usual instantaneous unit is watts per square metre, written W/m². The reading is about radiant power reaching the sensor’s plane; it is not an air-temperature reading, a promise of solar-panel output, or a measure of how bright a scene looks to a person.
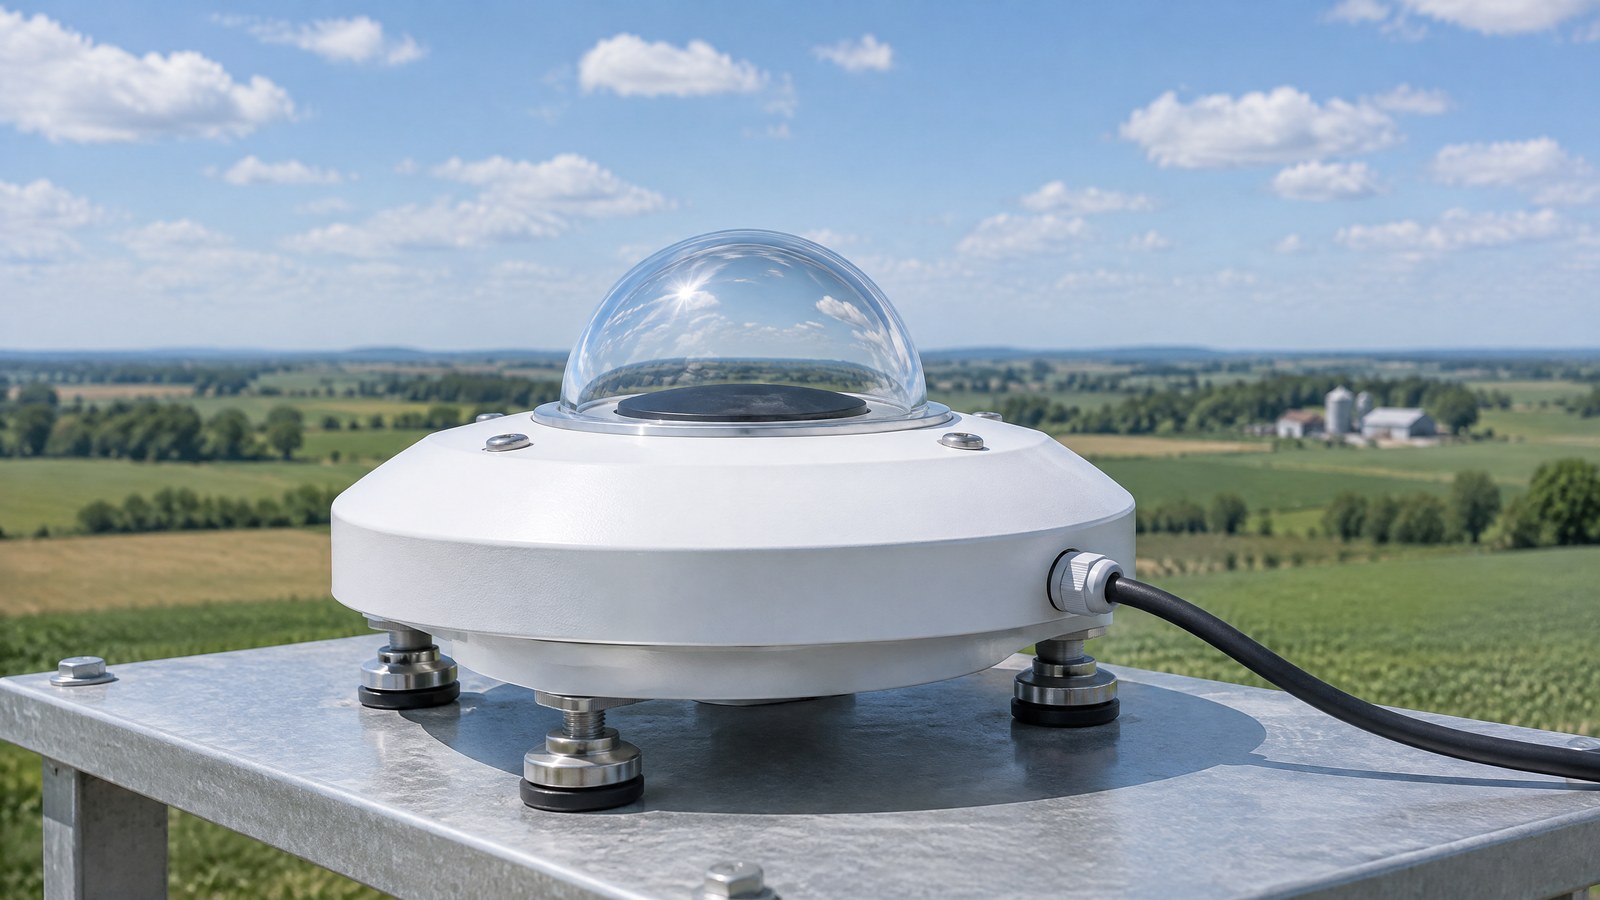
AI-generated editorial illustration of generic pyranometer hardware beside solar panels under an open sky, not a photograph of a tested product or an actual field measurement.
In an unobstructed setting, a horizontally oriented pyranometer with a hemispherical view records global horizontal irradiance: the combined contribution reaching that horizontal plane from the sun and the sky. Kipp & Zonen’s technical explanation treats this as a broad sun-and-sky measurement, while NOAA separately describes a direct-beam pyrheliometer as a narrow-view instrument [2] [6]. That distinction matters whenever a report uses the word “solar radiation” without naming the geometry.
Irradiance is power at a moment; energy is its accumulation
W/m² describes a rate at the instant or averaging interval represented by a reading. When a data record is summed over time, the result can be expressed as energy per area, such as Wh/m² or kWh/m². These quantities are related but not interchangeable: a high short-lived irradiance value does not by itself reveal the day’s accumulated solar energy.
This separation is especially helpful when comparing a passing-cloud pattern with an all-day total. The former asks how irradiance changed through the day; the latter asks how much radiant energy arrived over the chosen period. A responsible record preserves the plane, units, time basis and sensor type rather than treating one number as a complete account.
How Thermopile and Silicon Designs Create a Reading
The word pyranometer describes a measurement purpose, not a single detector technology. Thermopile and silicon instruments can both be calibrated to report W/m², yet they sense incoming radiation differently. Knowing that difference helps a reader judge whether two records are directly comparable rather than assuming matching units mean matching spectral behaviour.
Thermopile designs respond to absorbed radiation
A thermopile pyranometer places a black absorbing surface above a set of thermoelectric junctions. Radiation warms the active junctions relative to junctions coupled to the housing, creating a small electrical signal. Its calibration sensitivity converts that signal into irradiance. A hemispherical glass or quartz dome protects the receiving surface and is part of the optical and thermal behaviour of the instrument [1].
Because the absorber is intended to respond across a broad part of the solar spectrum, thermopile designs are often used where broad-spectrum irradiance context is important. That does not make every thermopile reading automatically comparable: the stated calibration, condition of the dome, measurement interval and mounting geometry still matter.
Silicon designs respond through a photodiode
A silicon solar-radiation sensor uses a photodiode whose current changes with incoming photon flux. EKO Instruments describes silicon response as concentrated in a narrower visible and near-infrared region than a broad-response thermopile. A silicon sensor can therefore report W/m² after calibration while retaining a different spectral sensitivity [4].
That difference becomes relevant when the spectrum changes with atmospheric conditions, low sun angles or other circumstances. The careful interpretation is not that one technology is universally “right” and the other “wrong”; it is that the instrument’s documented response, calibration and intended comparison should be known before drawing a precise conclusion from a difference in readings.
Why the Receiving Plane Matters
Solar irradiance belongs to a plane. A sensor facing the horizontal and a sensor aligned with a tilted surface do not ask the same physical question, even at the same site and moment. The angle changes how much of the direct solar beam projects onto the receiving area, while the sky and surroundings contribute diffuse and reflected components.
For global horizontal irradiance, Kipp & Zonen describes the horizontal result as a combination of diffuse sky radiation and the direct-normal component projected onto the horizontal plane [2]. This makes “the solar radiation here” an incomplete description. A defensible note says whether the value is horizontal, tilted, shaded for a diffuse measurement, or otherwise configured.
Horizontal, tilted and direct-beam quantities answer different questions
A horizontal pyranometer is useful for weather and resource descriptions because it measures what reaches a horizontal reference surface. A pyranometer on a tilted plane can instead describe radiation incident on that particular plane. Direct normal irradiance is another quantity: it refers to the direct solar beam on a surface normal to the sun and is measured with a direct-beam instrument, not inferred from an ordinary all-sky pyranometer alone [2] [6].
The practical insight is simple: compare like with like. A daily horizontal total should not be used as if it were the radiation on a particular tilted module, greenhouse roof or other surface. Conversely, a plane-of-array observation should not be relabelled as general horizontal weather data.
A Pyranometer Is Not a Lux Meter or a PAR Sensor
These devices all respond to light, but they are built around different questions. A pyranometer represents broadband solar irradiance in W/m². A photometric lux meter weights light roughly according to human visual sensitivity, while a PAR or quantum sensor reports photosynthetic photon flux density for plant-light assessment. LI-COR presents these as separate measurement categories with separate units and uses [3].
For a broader primer on common light-detection categories, see the [light sensor guide](/article/light-sensor-working-principle-types). It is not safe to substitute a lux value for irradiance or PAR, or to apply a universal conversion among them, because the source spectrum and the weighting built into each measurement are different.
What Can Change a Reading Before It Becomes Useful Evidence
A numerical reading gains meaning from its conditions. Dirt, dew, rain residue, damage or condensation on a dome can alter the radiation reaching the detector; Kipp & Zonen specifically identifies environmental protection of the receiving surface as a reason for the dome [1]. Nearby structures, trees, equipment or the sensor’s own support can also create time-dependent shade. A clean-looking dataset can still be misleading if its horizon and plane are undocumented.
Technology also matters. The narrower spectral response of a silicon design means changes in the incident spectrum can affect how its calibrated W/m² output tracks a broad-spectrum reference [4]. This is a limitation of interpretation, not proof that a particular individual reading is faulty.
Calibration, context and limits of inference
Calibration links a detector signal to irradiance units, but calibration does not remove every real-world source of uncertainty. A useful record identifies the instrument model or detector class, calibration information, plane, sampling or averaging basis, and visible obstructions. If two datasets differ, those details are the first place to look before assigning a cause.
A pyranometer can support weather description, solar-resource assessment or a monitored comparison, but it cannot by itself certify panel condition, predict a harvest, set irrigation, establish drinking-water safety or diagnose an ecosystem. Qualified review and the relevant measurements are needed when a decision has safety, financial or agronomic consequences.
India Context: Describe Conditions Before Drawing Conclusions
In India, solar-radiation observations are part of formal resource-assessment work rather than a novelty reading on a weather display. The National Institute of Solar Energy describes its Solar Radiation Resource Assessment programme as a ground-measurement network and names GHI, DHI and DNI as distinct parameters in its facility context [5]. The example reinforces the value of naming the quantity rather than using a catch-all “sunlight” label.
For an agriculture or water-site reader, a solar-radiation record can describe the energy arriving at a documented plane above a field, roof or solar-powered installation. It does not describe water quality or fish health, and it should not be treated as a stand-alone instruction for crop, irrigation or treatment decisions. Local shade, monsoon cloud patterns and maintenance conditions can make a site record more informative than a generic regional assumption, but only within the limits of its documented setup.
Important Points / Key Information
The central discipline with pyranometer data is to preserve what was actually measured: broadband solar irradiance incident on a particular plane, at a stated time basis, through a detector with known response and calibration context. The same W/m² unit on two displays does not prove that the underlying measurements answer the same question.
Key Takeaways
- A pyranometer reports irradiance, normally W/m², not air temperature, visual brightness or a guaranteed power yield.
- Accumulated energy per area is calculated from irradiance over time; it is different from an instantaneous irradiance reading.
- Thermopile and silicon instruments use different detector physics and can respond differently when the solar spectrum changes.
- Horizontal, tilted and direct-normal quantities must be labelled and compared only with like quantities.
- Lux, PAR/PPFD and broadband irradiance use different weighting and units; there is no universal interchange rule.
Examples / Supporting Information
Documented institutional example: NISE describes a solar-resource assessment facility that distinguishes GHI, DHI and DNI and pairs solar-radiation observations with meteorological parameters [5]. This is a useful model for terminology: the value of the data begins with stating which component and which geometry are being observed, not with reducing every reading to one generic solar number.
Hypothetical example: a reader comparing a rooftop solar surface with open-weather conditions could keep one record explicitly labelled “horizontal irradiance” and another explicitly labelled “irradiance on the roof plane.” A lower value on one record would not automatically indicate a fault, because the two instruments may be describing different planes or seeing different temporary shading. This is an explanation of interpretation, not a test result or a maintenance instruction.
Supporting technical example: LI-COR distinguishes a W/m² global-solar measurement, a PPFD quantum measurement for plant-light use, and a lux measurement weighted for human vision [3]. The three devices may all be placed in daylight, yet they report different properties of that daylight.
Conclusion
A solar-radiation sensor or pyranometer is most useful when it is understood as an instrument for irradiance on a defined receiving plane. Its W/m² reading becomes more informative when paired with a time basis, plane orientation, detector type and calibration context, and it should not be confused with lux, PAR or a direct measure of equipment or biological performance.
This article makes no claim to have measured a product, a site or a real-world outcome.
How we checked thisSources (6)
We keep source links private so your reading stays on techduopulse. Each note names the publisher and document we checked.
Kipp & Zonen explanation of thermopile pyranometer operation
Primary source · What a Solar-Radiation Sensor / Pyranometer Measures; How Thermopile and Silicon Designs Create a ReadingKipp & Zonen guide to horizontal and tilted global solar irradiance
Primary source · Why the Receiving Plane MattersLI-COR overview of PAR, global solar radiation and photometric measurement
Primary source · A Pyranometer Is Not a Lux Meter or a PAR SensorEKO Instruments comparison of thermopile and silicon pyranometer concepts
Primary source · How Thermopile and Silicon Designs Create a Reading; What Can Change a ReadingNational Institute of Solar Energy solar-resource assessment context in India
Primary source · India Context: Describe Conditions Before Drawing Conclusions; Examples / Supporting InformationNOAA instrument context for sun-and-sky and direct-beam radiation measurement
Primary source · Why the Receiving Plane MattersOwner-approved educational sensor explainer; obsolete private-draft status removed without changing source-backed facts or professional safety boundaries. Original generic AI editorial illustration, not a product or field-test photograph.