A leaf-wetness sensor turns a fleeting film of dew, rain or irrigation water into a time-based clue about crop conditions. Its value is not that it diagnoses a plant problem, but that it helps a weather record describe how long leaf-like surfaces stayed wet.
On this page 4 sections
Part of our emerging technology science guide library
What a Leaf-Wetness Sensor Measures
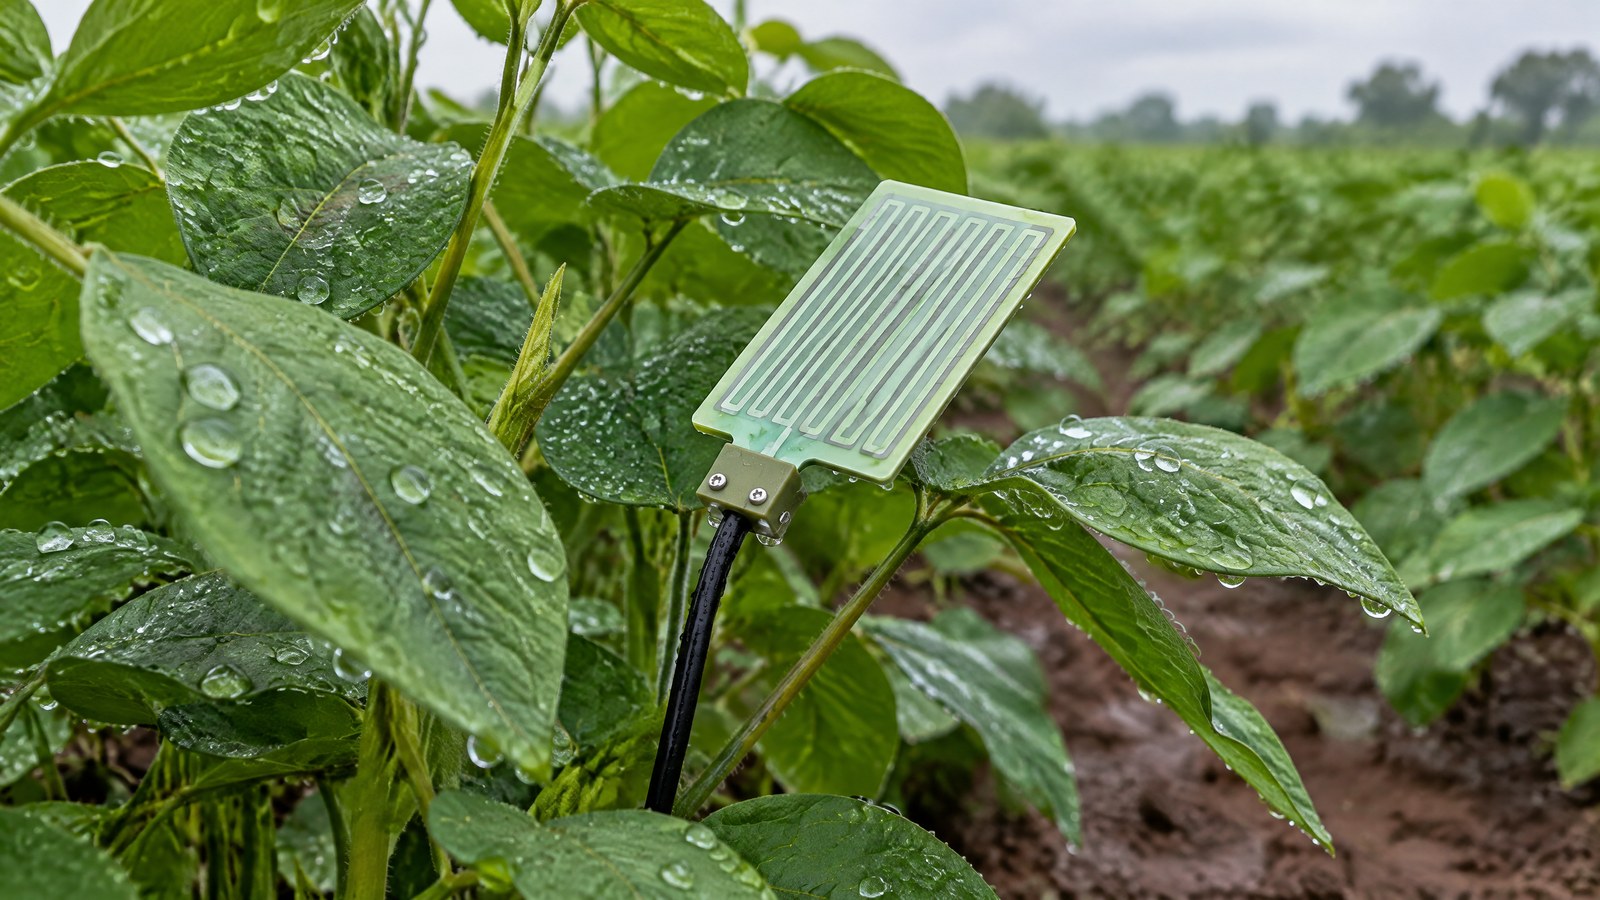
AI-generated editorial illustration of generic leaf-wetness sensing hardware beside crop foliage, not a photograph of a tested product or an actual field measurement.
A leaf-wetness sensor does not measure water stored inside a plant or in the soil. It estimates whether a leaf-like sensing surface is dry, damp or wet, then converts those intervals into leaf-wetness duration, often shortened to LWD: the time free water persists on a canopy surface after rain, dew, fog or overhead irrigation. [1]
That distinction matters because a wet period can be more informative to a crop-risk model than a single snapshot. The sensor is an environmental input, not a plant-health diagnosis, a universal risk score or proof that a disease is present.
Wetness Duration Is About Surface Water, Not Water Amount
In this context, leaf wetness means free water on the outside of leaves or the surrounding canopy. The duration begins when a sensing surface is classified as wet and ends when it is classified as dry; it does not tell a reader how much water a leaf absorbed or how much rain fell. Dew can create a wet interval without recorded rainfall, while a brief shower may create a shorter or longer interval depending on drying conditions. [1]
Canopy density, shade, leaf angle, air movement and the surface of the crop can all change how long water remains. This is why a useful record describes conditions at a representative location rather than pretending one device speaks for every leaf in a field. [1]
How Common Sensor Designs Infer Wetness
Most electronic designs infer wetness from a change at the sensor surface. In resistive or impedance-based designs, a water film changes the electrical path between electrodes. In dielectric designs, moisture changes the electrical properties sensed just above the surface; the resulting signal can be classified over time as dry or wet. [1] [3]
A device therefore needs an interpretation rule, often a threshold or another classification method, to turn its raw signal into a wet interval. That rule is part of the measurement method, not a biological fact. Keeping the underlying signal and its context can help a qualified reviewer judge whether an apparent wet period is credible. [3]
Why a Sensor Is a Proxy for Nearby Leaves
Attaching a durable instrument to a representative living leaf is difficult because leaves move, age and receive different sun exposure. A leaf-wetness sensor instead uses a designed surface to estimate the state of nearby foliage. Campbell Scientific describes this as an inference, and the APS review notes that wetness can differ within a single plant and across locations. [2] [3]
The proxy has limits. A smooth, waxy leaf, a hairy leaf and a broad leaf that catches water differently may not dry at the same time as a standard sensing plate. A reading is strongest when its sensor type, placement, crop canopy and weather context are considered together.
Leaf Wetness, Humidity, Soil Moisture and Rainfall Are Different Signals
Relative humidity describes water vapour in air; high humidity can make drying slower, but it does not itself prove free water is present on a leaf. Soil moisture describes water in the root-zone material. Rainfall records precipitation, but may not capture dew and cannot by itself show how long a canopy remained wet. [1]
These measurements can complement one another without being interchangeable. For the difference between root-zone water and leaf-surface conditions, see the site’s [soil-moisture sensor explainer](/article/soil-moisture-sensor-working-india). A disease-risk model may combine wetness duration with temperature and other crop- or pathogen-specific inputs, rather than substituting one sensor for another. [1]
Why Crop Risk Models Use This Input
Many bacterial, fungal and oomycete disease processes are associated with free water on foliage under suitable temperatures. The scientific review behind [2] explains that disease-warning systems use relationships between wetness duration and temperature because the relevant conditions differ by host–pathogen interaction. That is a more careful claim than saying every wet leaf will become diseased.
A model output should be read as decision-support context. It cannot identify a pathogen from a weather signal, inspect plant symptoms or prescribe a response on its own. Crop-specific interpretation, local conditions and qualified agronomic or plant-health review remain necessary before any action is considered.
Relevant Sensor Types and an India-Use Context
Flat-plate resistive sensors, paper-based resistive sensors and dielectric sensors are among the designs described in extension and technical documentation. Their surfaces and wet/dry classification methods differ, so readings should not be treated as automatically comparable across models. [1] [3] Research teams are also studying leaf-mimicking surfaces because real leaves vary in shape, texture and water repellence. [4]
Consider a hypothetical crop-weather record in India after a humid night or an irrigation event: leaf-wetness duration could be logged beside temperature, rainfall and crop notes to describe whether a leaf-like surface stayed wet into the morning. That record may help a locally validated model or qualified adviser assess conditions, but it does not verify disease, determine water needs or supply a treatment instruction.
Important Points / Key Information
A useful leaf-wetness record depends on more than the device. Sensor surface condition, exposure, location relative to the relevant canopy and the interpretation rule can affect the apparent duration. University of Florida Extension warns that unsuitable installation and maintenance can distort disease-risk monitoring; a manufacturer’s manual likewise notes that dust and debris can shift a dry baseline. [1] [3]
Do not use a single wetness-duration value as a universal disease threshold, a crop diagnosis or a pesticide decision. The appropriate meaning depends on the crop, the possible disease process, the local weather context and a model that has been validated for that purpose.
- A leaf-wetness sensor estimates free water on a leaf-like surface; it does not measure plant water content.
- Its key output is often leaf-wetness duration: how long the surface is classified as wet.
- Humidity, soil moisture and rainfall may provide useful context, but none is a replacement for leaf-surface wetness duration.
- Sensor data can support a crop disease-risk model, not confirm disease or prescribe treatment.
Examples / Supporting Information
The examples below illustrate why interpretation matters. They are evidence-based context, not product endorsements, field-test results or instructions for managing a crop.
Extension example: representativeness affects the result
In a Florida Extension example, University of Florida authors explain that placement, orientation, contamination and surface condition can make a sensor unrepresentative of wetness at plant height. The transferable lesson is to match a measurement setup to the model and crop context it is meant to inform; the document’s site-specific installation details are not a one-size-fits-all prescription for Indian farms. [1]
Research example: why leaf-like surfaces are being studied
A University of California, Santa Cruz report describes researchers developing biomimetic sensing surfaces that copy properties of particular leaves, including shape, texture and water repellence. The report presents tests on three leaf types and frames the work as a route toward more crop-specific measurements. It does not establish that a conventional commercial sensor is equally accurate for every plant or field. [4]
Hypothetical record: reading signals together
Hypothetical example: a weather log shows no rain overnight, high relative humidity and a wetness interval that ends after sunrise. The cautious interpretation is that dew may be one possible explanation, not that disease occurred. A reviewer would also need to consider sensor condition, local temperature, canopy conditions and any crop-specific model before drawing a risk-related conclusion. [1]
Conclusion
A leaf-wetness sensor makes a hard-to-see part of crop weather observable by estimating how long a leaf-like surface remains wet. Its best use is as one carefully interpreted input alongside temperature, rainfall, humidity and crop-specific knowledge—not as a standalone diagnosis or management command.
Crop-management use requires qualified professional assessment.
How we checked thisSources (4)
We keep source links private so your reading stays on techduopulse. Each note names the publisher and document we checked.
University of Florida Extension guidance on leaf-wetness duration and measurement context
Primary source · Definition, limitations and supporting extension examplePeer-reviewed review of leaf-wetness duration and disease-management models
Primary source · Definition, duration, model context and measurement limitationsTechnical manual describing dielectric leaf-wetness sensing and proxy limits
Primary source · How dielectric sensors infer wetness and why they are proxiesUniversity report on biomimetic leaf-wetness sensor research
Secondary source · Relevant sensor types and research supporting exampleOwner-approved educational sensor explainer; obsolete private-draft status removed without changing source-backed facts or professional safety boundaries. Original generic AI editorial illustration, not a product or field-test photograph.