When a storm is far from a weather radar, or lightning begins over the sea, forecasters still need a way to see electrical activity quickly. The Geostationary Lightning Mapper (GLM) is a near-infrared optical detector on GOES-R satellites that watches its viewing region for brief flashes and maps where, when and how widely lightning occurs.
This article is part of the computer hardware technology guide library.
Key takeaways
The Geostationary Lightning Mapper is a single-channel near-infrared optical transient detector, not an ordinary cloud camera.
It measures total lightning activity, including in-cloud, cloud-to-cloud and cloud-to-ground flashes, but its data do not distinguish those three types by themselves.
GLM gives continuous coverage over the Americas and nearby ocean regions, helping fill gaps where radar or surface observations are limited.
Its maps support severe-weather, hurricane, aviation and wildfire decisions, but they work best when combined with radar, other satellite data and surface observations.
- GLM senses short-lived near-infrared changes caused by lightning.
- It reports more than a yes-or-no strike: products can describe flash location, extent, timing and radiant energy.
- Coverage is regional rather than global, and GLM is not a standalone forecast instrument.
What is the Geostationary Lightning Mapper?
The Geostationary Lightning Mapper, usually shortened to GLM, is an optical instrument carried by the GOES-R series of geostationary weather satellites. NOAA describes it as a single-channel, near-infrared optical transient detector. In simple terms, it repeatedly looks at the same broad part of Earth and searches for momentary changes in the scene that indicate lightning.
That makes GLM different from a normal visible-light weather image. A cloud camera is mainly showing cloud shapes, textures and movement. GLM is looking for fast optical events associated with lightning, including activity inside clouds that may not be visible as a strike from the ground. It is also different from a ground lightning network: ground systems generally use radio-frequency measurements, while GLM observes the flash optically from orbit. NOAA treats the two approaches as complementary rather than interchangeable.
Because the spacecraft remains in geostationary orbit, GLM can keep watching the same region instead of passing over it only once or twice a day. The instrument's useful viewing area covers the Americas and adjacent ocean regions, not the entire planet.
How does a GOES GLM sensor detect lightning?
Lightning produces a very brief optical pulse. GLM observes a narrow near-infrared band centred at 777.4 nanometres and looks for a change against the surrounding optical scene. Its staring CCD imager samples rapidly enough to capture these transient events; NOAA lists a 2 millisecond frame rate and a product latency of about 20 seconds for the instrument system.
The raw observation is not simply a photograph labelled lightning. The processing chain identifies optical events and groups them using their timing and location. A group is made from one or more events that meet temporal and spatial coincidence rules, while a flash is built from one or more related groups. This hierarchy helps turn many short detections into a description of a lightning flash that forecasters can track.
The instrument can detect total lightning activity in clouds, between clouds and from cloud to ground, but NASA Earthdata cautions that the GLM dataset cannot distinguish those categories on its own. A GLM signal should therefore be read as optical lightning information, not as proof of the exact lightning type at every point.
- Optical event: a short-lived lightning-related change detected by the instrument.
- Group: one or more nearby events linked by time and space.
- Flash: one or more groups combined into a larger lightning event with an extent and duration.
- Gridded product: a map that summarises flash activity over cells and a chosen time window.
What information does GLM data provide?
GLM data can provide the time, location, areal extent and radiant energy of individual flashes. NOAA's operational products also include Flash Extent Density (FED), Average Flash Area (AFA) and Total Optical Energy (TOE). FED summarises how many flashes occur within a grid cell during a period. AFA describes the average area of flashes associated with a cell, while TOE sums the observed optical energy there.
These products help a meteorologist look at storm structure and change rather than count isolated dots. A rapid increase in flash rate, often called a lightning jump, can be a sign that a storm's updrafts are intensifying. GLM does not predict a tornado or severe weather by itself. Instead, the trend gives forecasters another piece of evidence to compare with radar, satellite imagery, models and surface reports.
The instrument is designed for broad storm-scale monitoring. NOAA lists near-uniform spatial resolution of about 8 km at nadir and 14 km toward the edge of the field of view, with coverage reaching roughly 52 degrees north on its characteristics page. These figures describe the instrument's observing geometry, not the accuracy of every individual lightning location.
| GLM information | What it helps describe | Important limit |
|---|---|---|
| Event, group and flash location | Where optical lightning activity is occurring | The dataset does not independently label every flash as in-cloud or cloud-to-ground |
| Flash extent and duration | How far and how long a detected flash develops | Resolution and detection vary across the field of view |
| FED, AFA and TOE grids | Flash concentration, average area and optical energy over time | These are interpretation products, not direct rainfall or wind measurements |
Why weather, aviation and wildfire teams use GLM
For severe-weather monitoring, the value of GLM is its continuous view. A rapid rise in lightning can alert forecasters to a strengthening convective storm before other signs become clear. GLM can continue to provide context over mountainous areas, rural locations and oceans where radar or surface instruments are sparse. It is normally used alongside those systems, not as a replacement for them.
In tropical cyclones, changes in lightning distribution can help analysts follow evolving convection inside the storm. For aviation, lightning maps add information for route planning and airport hazard awareness, especially over oceanic routes. For wildfire work, GLM can highlight lightning activity that may be capable of starting a fire in a remote area and can help monitor electrically active smoke-driven storms.
The same broad view can support precipitation and flash-flood analysis because strong convective updrafts and lightning often occur together. That relationship is useful evidence, but it is not a promise that every lightning increase produces a particular amount of rain. Local weather observations and forecasting tools remain necessary.
- Severe storms: track lightning trends that may accompany intensification.
- Hurricanes: follow electrically active convection as a storm evolves.
- Aviation: add storm and lightning context where routes or airports have limited ground coverage.
- Wildfires: identify lightning activity that may help prioritise remote-fire checks.
- Research: build long-term records of lightning activity within the GOES viewing region.
GLM limitations: what this satellite sensor cannot tell you
GLM is a specialised optical detector, so it should not be treated as a universal weather sensor. It does not directly measure rainfall, wind speed, temperature, cloud height or ground electric-field strength. Its observations are also limited to the GOES-R viewing region and can be affected by viewing angle, optical conditions and the instrument's detection performance.
A GLM map can show that lightning-related optical activity is present, but it cannot by itself tell a reader whether a particular flash was cloud-to-ground or in-cloud. It also cannot replace a local warning system, radar interpretation or official emergency advice. The safest interpretation is to combine the GLM signal with other observations and follow local weather alerts when lightning is possible.
Finally, the word sensor can be misleading here. GLM is not a small standalone photosensor that can be wired to a microcontroller. It is a spaceborne instrument with an optical assembly, detector, processing chain, spacecraft power and communications, and ground-based product generation. Those supporting components are part of the operational system even though the physical measurement begins with the optical detector.
Geostationary Lightning Mapper FAQs
These short answers separate what GLM measures from what forecasters infer by combining it with other data.
What does the Geostationary Lightning Mapper measure?
GLM measures brief near-infrared optical changes associated with total lightning activity. Its products describe events, groups and flashes, including their location, extent, timing and radiant energy.
Can GLM see lightning inside clouds?
Yes. GLM detects total lightning activity that includes in-cloud, cloud-to-cloud and cloud-to-ground flashes. NASA Earthdata notes that the dataset does not distinguish those categories by itself.
Is GLM a camera?
It uses a staring CCD imager, but it is not an ordinary visible-light cloud camera. GLM is a single-channel near-infrared optical transient detector designed to find rapid lightning-related changes.
Does GLM cover India?
The GOES-R GLM viewing region is the Americas and adjacent ocean areas. It is not a global lightning sensor, so its operational coverage should not be treated as coverage over India.
Can GLM predict tornadoes or rainfall on its own?
No. Lightning trends can provide useful evidence about storm development, but GLM is not a standalone tornado or rainfall forecast. Forecasters combine it with radar, other satellite observations, models and surface data.
About the image
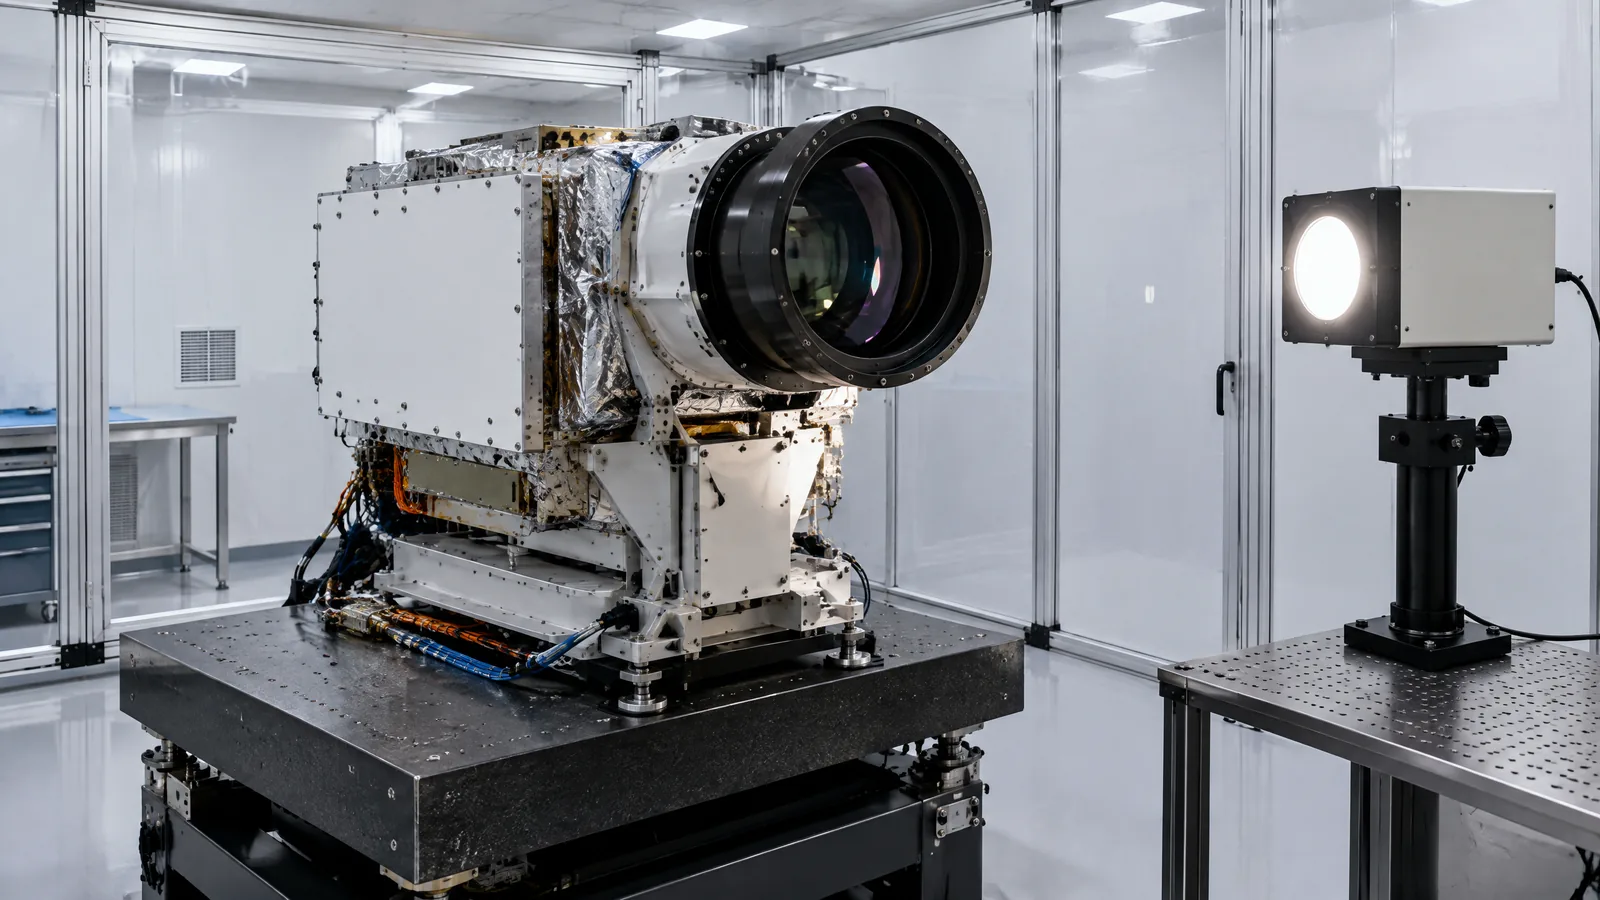
AI-generated editorial illustration; not an actual product or mission photograph.
Source notes
Reporting record
techduopulse stores source destinations privately. Public notes remain non-clickable so every visitor journey stays on this website.
Source note: NOAA/NESDIS GLM instrument overview and applications
Primary source · Near-infrared detector, coverage, characteristics, latency, weather, aviation and wildfire applicationsSource note: NOAA/NASA GOES-R GLM technical instrument page
Primary source · Optical transient detection, total-lightning scope, measurement characteristics and operational usesSource note: NOAA/NCEI GOES-R ABI/GLM product documentation
Primary source · Total-lightning definition, event/group/flash hierarchy, spatial resolution and product accessSource note: NASA Earthdata GLM gridded dataset description
Primary source · Operational geostationary optical detector, total-lightning types and inability to distinguish types in the datasetSource note: NOAA/NESDIS GLM lightning-detection fact sheet
Primary source · FED, AFA and TOE products; optical versus ground-network sensing; aviation, wildfire and storm applicationsNew satellite-application explainer for the Geostationary Lightning Mapper. It separates the GLM optical payload from ordinary light sensors and ground lightning networks, explains event/group/flash products, qualifies GOES-R regional coverage and type-identification limits, and frames weather, aviation and wildfire uses as complementary evidence rather than standalone forecasts.