When a storm is far from a weather station, a flat rain map cannot show whether precipitation is shallow, deep, liquid or frozen. A dual-frequency precipitation radar solves part of that problem by sending Ku- and Ka-band pulses from a satellite and measuring how returns change through the storm, producing three-dimensional information about rain and snow.
This article is part of the emerging technology science guide library.
Key takeaways
The GPM Dual-frequency Precipitation Radar (DPR) is an active radar instrument, not a camera or a passive brightness sensor.
Its KuPR operates at 13.6 GHz and its KaPR at 35.5 GHz; comparing the two frequencies helps describe precipitation structure and particle behaviour.
DPR observations can show rain and frozen precipitation in three dimensions, including over ocean and at night.
Satellite radar gives a moving, sampled view with retrieval uncertainty. It complements ground radar, gauges and the GPM Microwave Imager rather than replacing every local measurement.
What is a dual-frequency precipitation radar?
A dual-frequency precipitation radar is an active microwave instrument that transmits radio pulses toward Earth and listens for energy scattered back by raindrops, snowflakes, ice particles and other parts of a storm. “Active” means the instrument supplies the signal; it is different from a passive radiometer that measures naturally emitted microwave energy.
On NASA’s GPM Core Observatory, DPR combines two co-aligned radars. The Ku-band precipitation radar, or KuPR, works at 13.6 GHz. The Ka-band precipitation radar, or KaPR, works at 35.5 GHz. They observe the same footprint location so scientists can compare the returns rather than treating two unrelated images as one measurement.
The DPR itself is the radar hardware. The satellite bus provides orbit, power, pointing, communications and data storage. Ground processing turns the received measurements into precipitation products. The separate GPM Microwave Imager is another instrument with a different passive-microwave role; it can complement DPR observations, but it is not part of the DPR sensor.
How Ku and Ka bands reveal precipitation structure
A single radar frequency can show where the radar signal encounters precipitation. Two frequencies add a comparison. As pulses pass through a storm, their strength changes because of scattering and attenuation by hydrometeors. NASA describes the difference in attenuation between Ku and Ka as part of the rain-versus-snow determination.
The shorter-wavelength Ka-band measurement is especially useful for light rain and frozen particles, while Ku-band provides a wider context for moderate and heavy rain. The overlapping observations can also provide information about drop-size distributions: in simple terms, how many particles of different sizes are present and how they are spread through the storm. That is a scientific estimate, not a direct count of every raindrop.
By recording returns at different distances along the pulse path, DPR builds a vertical profile rather than only a surface colour. NASA describes the result as three-dimensional observations of rain and precipitation characteristics. The GPM brochure also describes two cross-track scanning radars and a nominal 5-km spatial resolution in its design discussion.
- KuPR: 13.6 GHz, useful for the broader precipitation structure and moderate-to-heavy rain.
- KaPR: 35.5 GHz, more sensitive to light rain and frozen precipitation.
- Combined Ku/Ka observations: additional clues about attenuation, rain or snow, and particle-size distributions.
What the GPM DPR is used for
DPR data help researchers study how storms grow, how precipitation particles form and change, and how rain and snowfall contribute to Earth’s water cycle. The measurements are also used alongside other observations to improve precipitation estimates and support weather and hazard research.
A satellite view is valuable where gauges or ground radar are sparse, including over oceans. Because the DPR observes from orbit, it can sample broad storm systems instead of being tied to one radar site. GPM’s mission page describes applications including tropical-cyclone monitoring, flood and drought research, landslide-related hazard work, weather prediction, agriculture and freshwater-resource studies.
For a reader looking at a GPM product, the key distinction is between an observation and a derived estimate. The radar measures returned microwave signals. Algorithms then infer quantities such as precipitation type, rate, particle properties and accumulated rainfall. Each product therefore has assumptions and uncertainty that should be checked in its documentation.
What a satellite precipitation radar cannot tell you by itself
DPR is not a continuous video camera for every place on Earth. The spacecraft follows an orbit and the instrument measures a swath as it passes. A location between overpasses may have no new direct DPR observation at the moment a storm changes. Broader time-complete maps can combine DPR with other satellites and algorithms, but that combined product is not identical to one radar scan.
Radar returns also need interpretation. Heavy precipitation can weaken the signal as it travels, surfaces can contribute unwanted echoes, and the distinction between liquid and frozen particles is not a perfect visual label. The exact result depends on geometry, frequency, retrieval method and the conditions in the observed column.
DPR should therefore be treated as complementary evidence. Ground radar can provide more frequent local coverage where it exists, while gauges offer point measurements at the surface. Passive instruments such as GMI add a wider microwave view. None of these sources alone answers every question about a storm.
Dual-frequency precipitation radar FAQs
These answers refer to the GPM DPR described in NASA’s mission and instrument documentation. They explain the instrument’s role without treating a derived precipitation product as a direct measurement of every drop.
What does the GPM Dual-frequency Precipitation Radar measure?
It measures returned Ku- and Ka-band microwave signals from precipitation and uses them to produce three-dimensional observations of rain and precipitation characteristics, including information useful for rain-versus-snow analysis.
What are the KuPR and KaPR frequencies?
NASA identifies 13.6 GHz for the Ku-band precipitation radar (KuPR) and 35.5 GHz for the Ka-band precipitation radar (KaPR). The two frequencies respond differently as they pass through rain, snow and ice.
Is DPR the same as the GPM Microwave Imager?
No. DPR is an active radar that transmits pulses and measures echoes. GMI is a separate passive microwave imager that measures naturally emitted microwave energy. Their data can complement one another.
Can DPR measure snow as well as rain?
Yes. NASA describes DPR as more sensitive to snowfall and light rain than its TRMM predecessor, and explains that the two-frequency response provides information that helps distinguish rain from snow. The output remains a retrieved estimate with limitations.
Does satellite radar replace a local weather radar?
No. DPR offers broad orbital sampling over land and ocean, but it does not continuously watch every location. Local radar and gauges can provide different timing, geometry and surface information, so the systems are complementary.
About the image
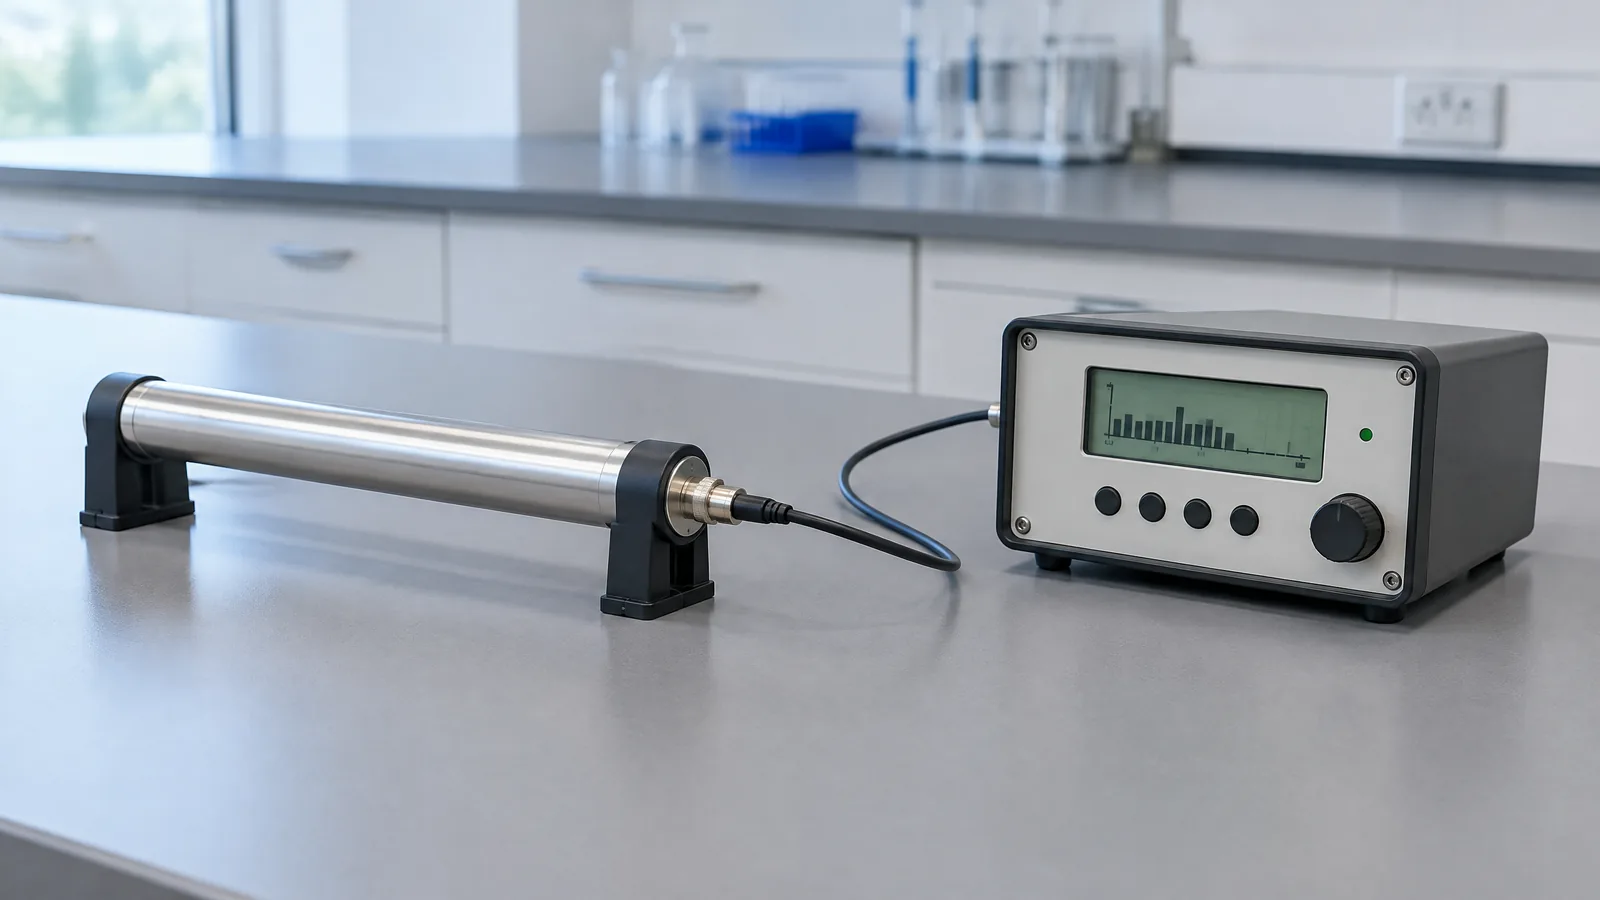
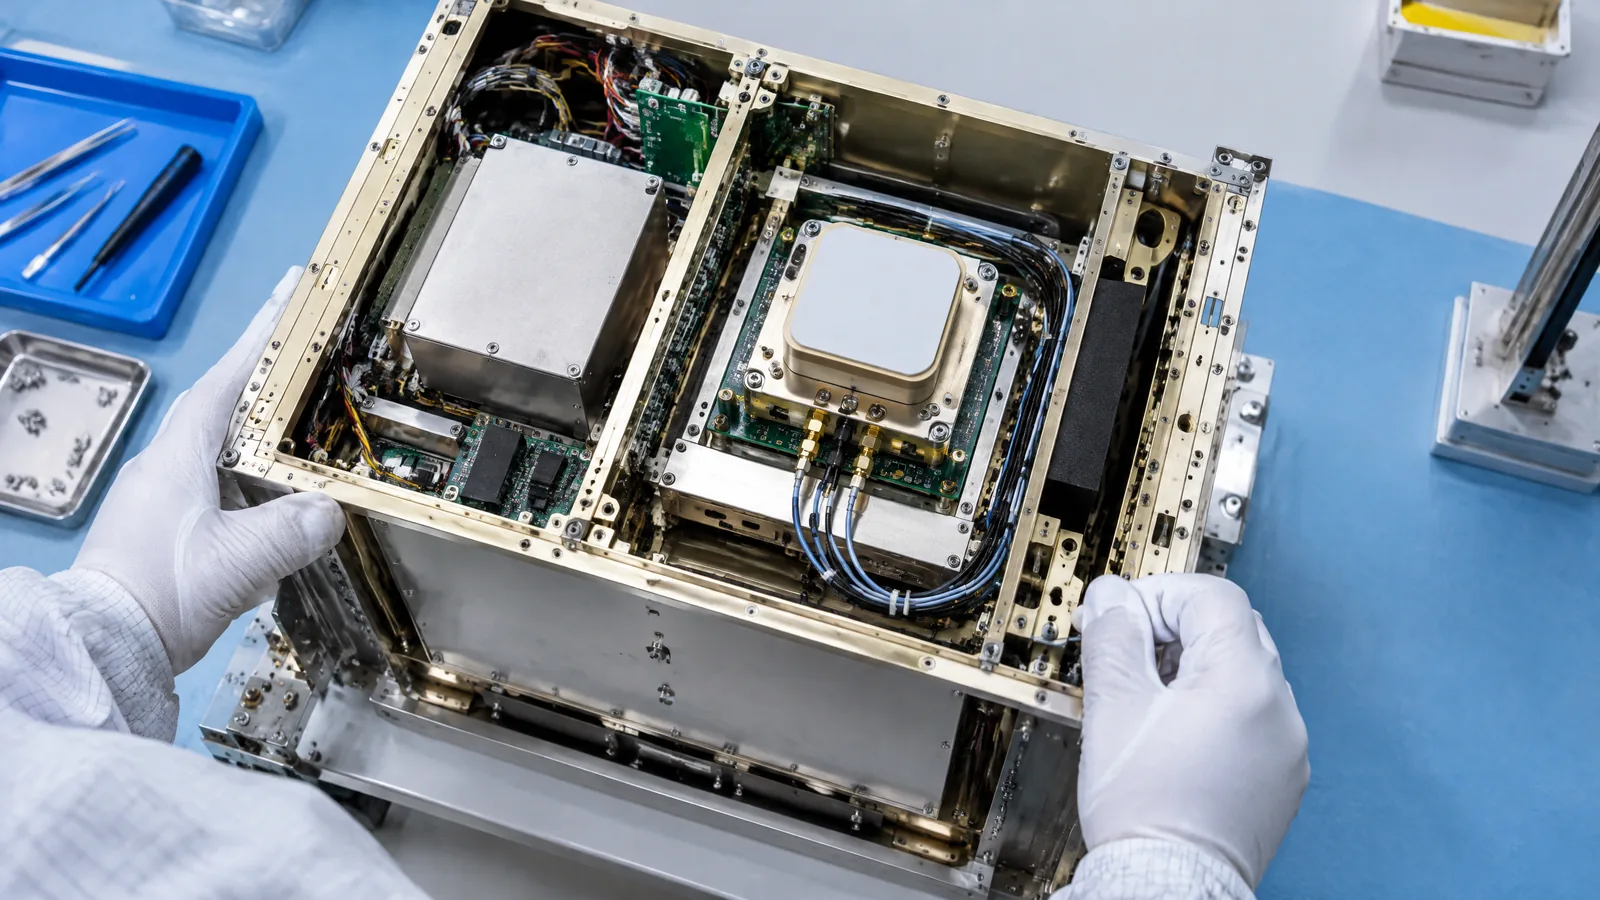
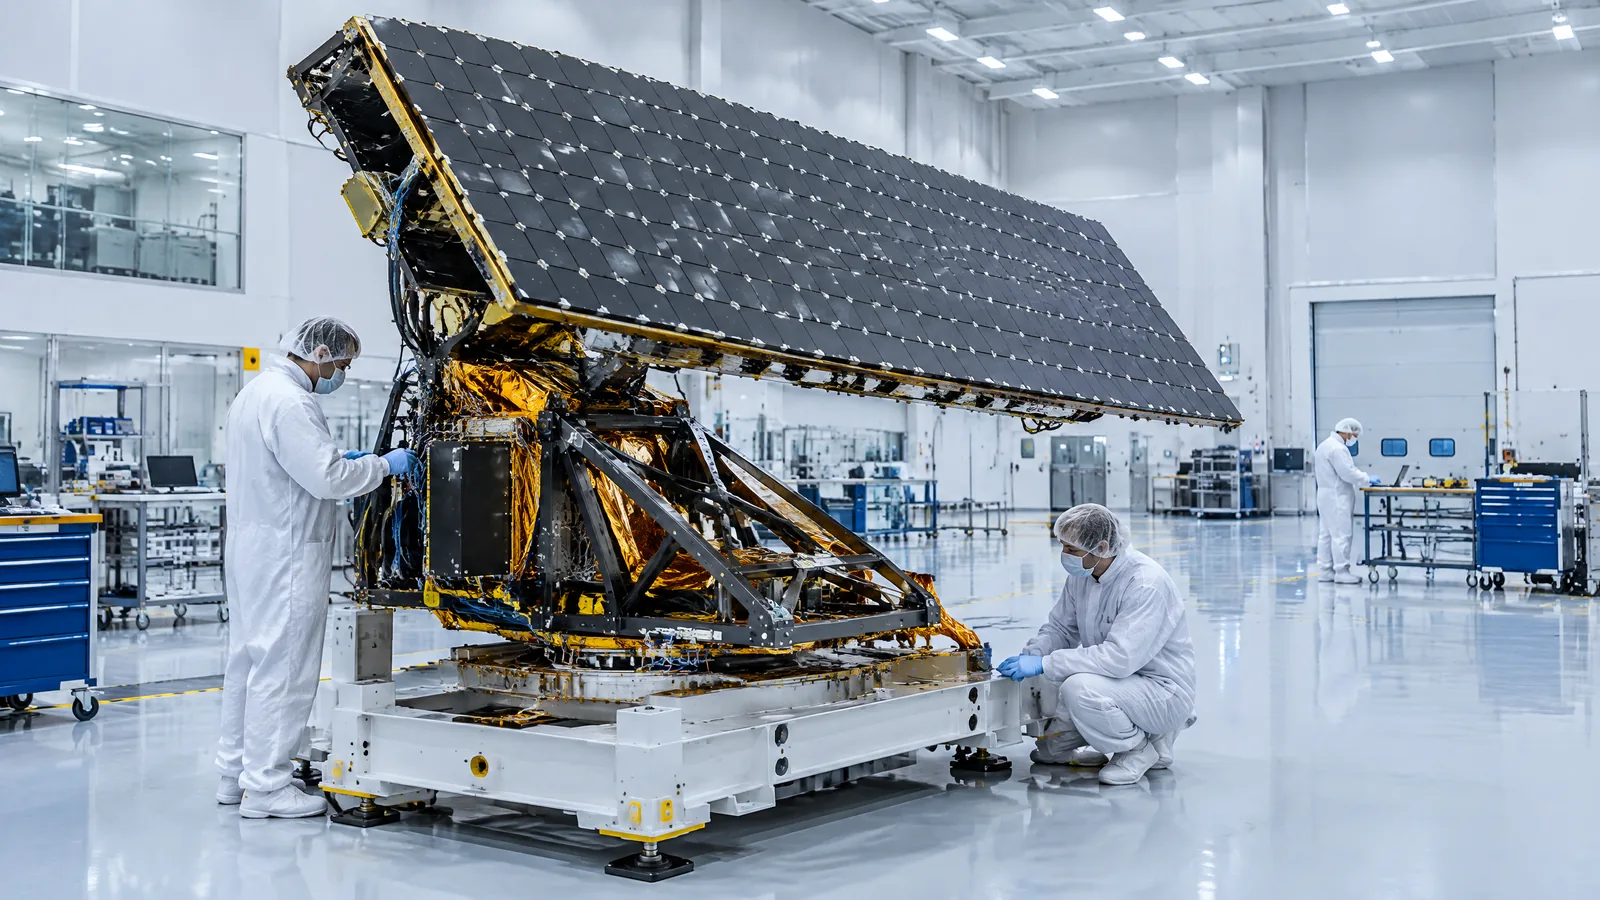
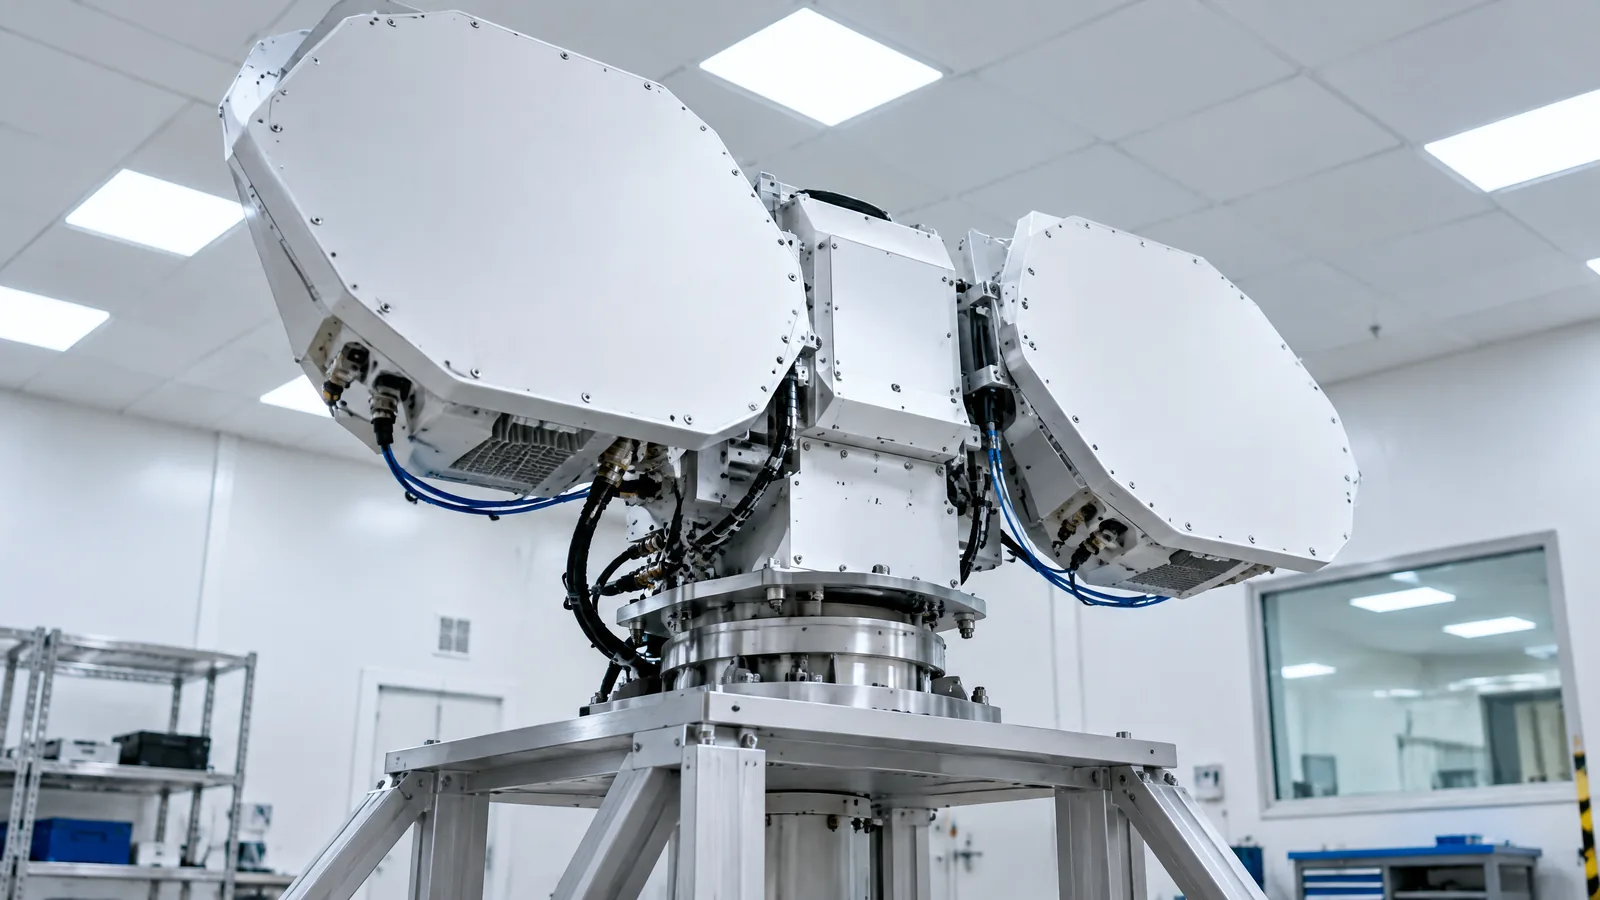
AI-generated editorial illustration; not an actual product or mission photograph.
Source notes
Reporting record
techduopulse stores source destinations privately. Public notes remain non-clickable so every visitor journey stays on this website.
Source note: NASA GPM mission overview
Primary source · Mission purpose, DPR frequencies, 3D precipitation structure, sensitivity and applicationsSource note: NASA DPR instrument overview and specifications
Primary source · KuPR/KaPR roles, co-alignment, rain/snow differential attenuation, land/ocean day/night operation and instrument contextSource note: NASA GPM mission brochure, DPR section
Primary source · Ku/Ka frequency roles, 3D precipitation rates and structures, particle-size information and radar scanning explanationNew distinct satellite-sensor explainer based on the supplied brief and three opened NASA technical sources. It separates the active DPR radar from GMI, the spacecraft bus and retrieval algorithms; explains Ku/Ka comparison, applications and sampling/retrieval limits without unsupported performance claims.