A field can look uniformly green from the ground while satellite data reveals differences in vegetation, soil or water conditions. The Sentinel-2 multispectral imager measures reflected sunlight in 13 selected spectral bands, giving Earth-observation teams more information than an ordinary colour photograph; its exact bands, resolutions and revisit are specific to the Sentinel-2 mission.
This article is part of the computer hardware technology guide library.
Key takeaways
The Sentinel-2 multispectral imager is a passive optical payload for observing land and vegetation. It does not measure a single universal ‘health’ value; it records band-specific reflected light that can be corrected and analysed.
- Sentinel-2 uses 13 spectral bands spanning visible, near-infrared and shortwave-infrared wavelengths.
- Its mission has 10 m, 20 m and 60 m products rather than one resolution for every band.
- Red-edge bands add information about vegetation state, while repeat passes help reveal change over time.
- Clouds, haze, shadows, mixed pixels and processing choices can limit what an image can prove.
What is a Sentinel-2 multispectral imager?
A multispectral imager captures measurements in several wavelength ranges instead of storing only the three broad colour channels normally associated with a visible-light photo. Sentinel-2 is a useful real-world example: the European Space Agency describes its payload as a wide-swath, high-resolution multispectral imager designed to provide a new view of land and vegetation. The mission combines two satellites, so coverage can be repeated as the satellites move along their orbits.
This is a passive sensor. It depends mainly on sunlight reflected from the surface and separates that incoming signal into spectral bands. The physical payload includes optics and focal planes. Ground systems and software then turn those measurements into image products. Those processing steps are part of the observation workflow, but they are not extra physical bands inside the imager.
The phrase ‘Sentinel-2 MSI class’ should therefore be read as a reference to this mission design. Other multispectral satellite sensors can use different bands, pixel sizes, swath widths, revisit schedules and calibration methods.
How the 13 bands separate information
Sentinel-2’s bands are not simply 13 copies of the same camera channel. ESA groups the mission’s measurements across visible and near-infrared wavelengths, red-edge bands, shortwave-infrared wavelengths and atmospheric-correction bands. Each range responds differently to materials and conditions on the ground, so comparing bands can reveal patterns that are difficult to see in a natural-colour image.
The instrument uses a push-broom concept: as the satellite moves, detector lines observe successive strips of ground and build a larger image. ESA reports a 290 km swath. That wide coverage is useful for regional mapping, but it does not mean every detail in the strip is equally resolved or equally reliable.
Resolution also varies by band. ESA reports four visible and near-infrared bands at 10 m, six red-edge/shortwave-infrared bands at 20 m and three atmospheric-correction bands at 60 m. A 10 m figure should not be attached to every band or treated as the physical size of every detected object.
| Sentinel-2 band group | Mission resolution | Why it matters |
|---|---|---|
| Visible and near-infrared | 10 m | Supports broad land and vegetation patterns at the finest listed mission resolution. |
| Red-edge and shortwave-infrared | 20 m | Adds sensitivity to vegetation-state and moisture-related spectral differences, with coarser pixels than the 10 m bands. |
| Atmospheric-correction bands | 60 m | Supports correction and interpretation of atmospheric effects; it is not a general-purpose 60 m camera mode. |
Why red-edge bands help with vegetation observation
Vegetation reflects and absorbs light differently across the visible, near-infrared and red-edge parts of the spectrum. Sentinel-2 was designed with three red-edge bands, which ESA says provide key information on vegetation state. This gives analysts more useful inputs for comparing crop or plant conditions than a visible photograph alone.
Those inputs can support derived measures and maps. ESA lists uses such as distinguishing crop types and estimating plant indices related to leaf area, leaf chlorophyll and leaf water content. These are analytical products, not direct readings from one detector and not automatic proof that a particular field needs water or fertiliser.
A sensible interpretation starts with a time series and local context. Analysts may compare dates, screen clouds, apply atmospheric correction and consider crop stage, soil, sun angle and field boundaries. A single coloured image can be a helpful visualisation, but it is not a complete diagnosis of what is happening on the ground.
How revisit time turns a picture into monitoring
Sentinel-2’s value is not only its band count. ESA describes a two-satellite constellation at 786 km altitude, with the spacecraft separated by 180 degrees. The constellation revisits the same spot at the equator every five days and can revisit more quickly at higher latitudes.
Repeated observations let users look for change: a vegetation pattern that persists across suitable cloud-free dates is more informative than one isolated scene. The five-day figure is a mission-level revisit description, not a promise that a clear, usable image will be available every five days at every location. Clouds, haze, viewing conditions and processing availability still matter.
The same distinction applies to resolution. A pixel is a sample covering an area, so a field boundary, narrow road or mixed patch may contain several surface types in one measurement. Finer resolution can help, but it cannot remove atmospheric or interpretation limits.
- Use the band combination or index that matches the question instead of assuming a natural-colour view shows every useful signal.
- Compare dates only after checking cloud, haze, shadow and acquisition conditions.
- Treat revisit and resolution as mission specifications, not as guarantees about the quality of every scene.
- Keep the satellite measurement separate from later classification, mapping or farm-management decisions.
What this sensor cannot tell you by itself
A multispectral imager measures reflected radiation in defined bands. It does not directly weigh a harvest, identify a plant disease with certainty, measure soil chemistry everywhere or replace field observations. Different surfaces can produce similar spectral responses, and one pixel can combine soil, crop, water and shadow.
Atmosphere is another limit. Clouds can hide the ground, while haze and changing illumination affect the signal. Calibration, atmospheric correction, geometric alignment and sensible thresholds are needed before comparing images. The product may also be resampled so bands with different native resolutions line up; that improves usability but does not create new fine detail in a coarser band.
For Indian readers, the practical lesson is simple: use Sentinel-2 imagery as evidence for mapping and change analysis, then check the date, cloud conditions, band or index used, pixel size and local context before drawing a conclusion. A mission example should not be mistaken for a universal sensor specification or a standalone decision system.
Frequently asked questions
Is the Sentinel-2 multispectral imager a normal camera?
It is an optical imaging payload, but it is not a consumer camera. It records reflected light in 13 selected spectral bands, including near-infrared, red-edge and shortwave-infrared ranges, at mission-specific resolutions.
Does Sentinel-2 always produce 10 m imagery?
No. ESA reports four bands at 10 m, six at 20 m and three atmospheric-correction bands at 60 m. The resolution depends on the band and product, so 10 m should not be applied to the whole instrument.
Why are Sentinel-2 red-edge bands useful?
ESA says the three red-edge bands provide key information on vegetation state. They add spectral detail for vegetation analysis, but interpretation still depends on correction, timing, cloud screening and local context.
Can Sentinel-2 detect crop disease automatically?
Not by itself. The imager supplies band measurements that can support models or indices, but a reliable conclusion needs suitable imagery, processing, validation and domain knowledge. A single image is not a guaranteed diagnosis.
What does a five-day revisit mean?
For the two-satellite Sentinel-2 constellation, ESA describes a five-day revisit of the same equatorial spot, with faster revisits at higher latitudes. Clouds and image usability can make the interval between usable observations longer.
About the image
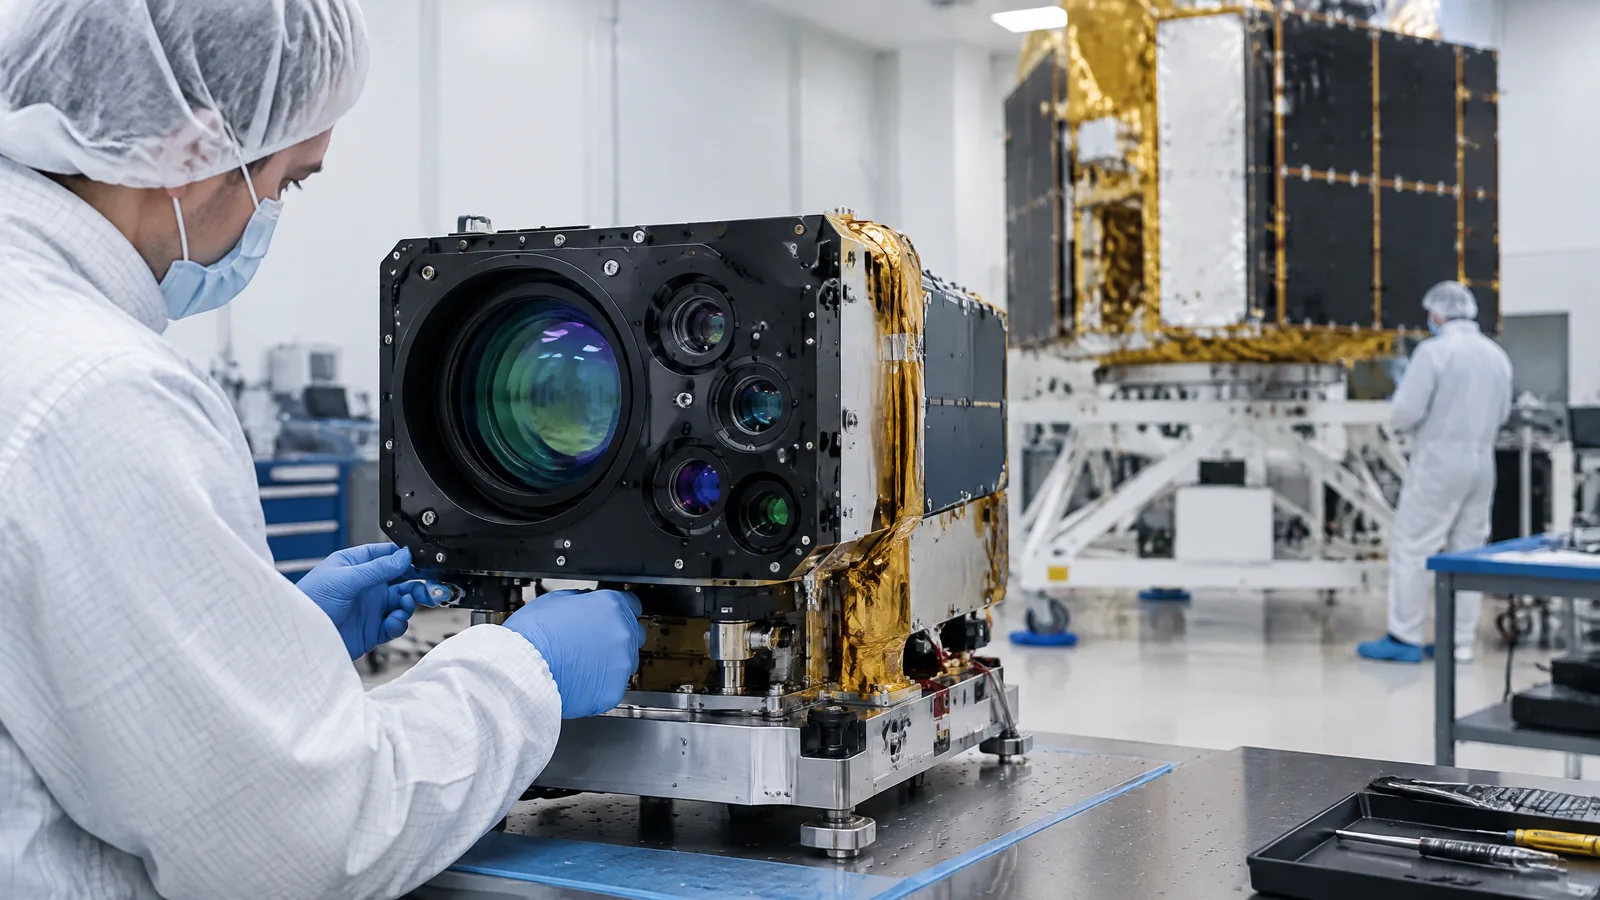
AI-generated editorial illustration; not an actual product or mission photograph.
Source notes
Reporting record
techduopulse stores source destinations privately. Public notes remain non-clickable so every visitor journey stays on this website.
Source note: ESA Sentinel-2 mission overview
Primary source · Mission purpose, two-satellite constellation, 13 bands, 10 m resolution, 290 km swath and five-day revisitSource note: ESA Sentinel-2 instrument description
Primary source · Push-broom design, focal planes, red-edge bands, 290 km swath and 10/20/60 m band groupsSource note: ESA Sentinel-2 plant-health applications
Primary source · Vegetation monitoring, crop-type distinction, plant indices and five-day revisit when both satellites are operationalSource note: ESA Sentinel-2 constellation description
Primary source · Two satellites, 786 km altitude, 180-degree separation and equator revisit explanationCreated a distinct Satellites application explainer because the supplied live pages cover smartphone cameras and generic light sensors, not Earth-observation multispectral imaging. Added mission-specific band and revisit limits, separated physical payload from processing and derived products, and avoided unsupported performance or field-decision claims.